Materials and resources
Resources for case studies and discussions
Direct internal links to:Notes:
1) Before the start of the workshop all resources proposed by the ice services for dissemination between the analysts should be submitted to local organize
2) Format for the ice charts and preanalyzed satellite imagery should be TIFF, JPEG, PNG (excluding material which will be shown by the analysts from the own laptops)
3) Formats for the imagery proposed for online analysis should be GeoTIFF
4) In some cases links were put to additional information from other sources. Links denoted with AMSR are to the respective passive microwave AMSR data in tif format (some compressed) available from the University of Bremen at www.seaice.de.
5) Case studies titles:
#1 - Differences in presentation of ice parameters on selected satellite imagery (SAR/visible/IR) analyzed before the workshop
#2 - Results of the online analysis of selected satellite imagery (SAR/passive microwave/visible/IR) by regions and national services
#3 - Differences in routine ice charts for the past season 2007-2008 by regions and national ice services
#4 - Assessment of uncertainties in the historical series of the ice charts since the start of the routine ice mapping using ice charts from the Baltic sea ice services for 1950s-2008 as a model
| Case study | Region | Description of material | Sea ice parameters and phenomena | Main supplier see note 4 above |
| 1,3 | Canadian Arctic/Beaufort Sea | Input for weekly icechart (data folder) | Ice type boundaries multi-year, first year, fast ice, young ice and leads. | CIS |
| 1 | Beaufort and Chukchi Seas | 2008-01-05 ENVISAT GMM | Fast ice, flaw polynya, multi-year and second-year ice | AARI |
| 2008-03-28 ENVISAT GMM | Fast ice, flaw polynya, multi-year ice | AARI | ||
| 2008-03-31 MODIS visible | Fast ice, polynyas, leads | AARI | ||
| 1 | Arctic Basin | 2007-02-02 QScat HH-ENVISAT GMM | Ice boundary, detection of FY, second-year and multi-year ice boundaries | AARI |
| 2008-02-10 QScat HH-ENVISAT GMM | ||||
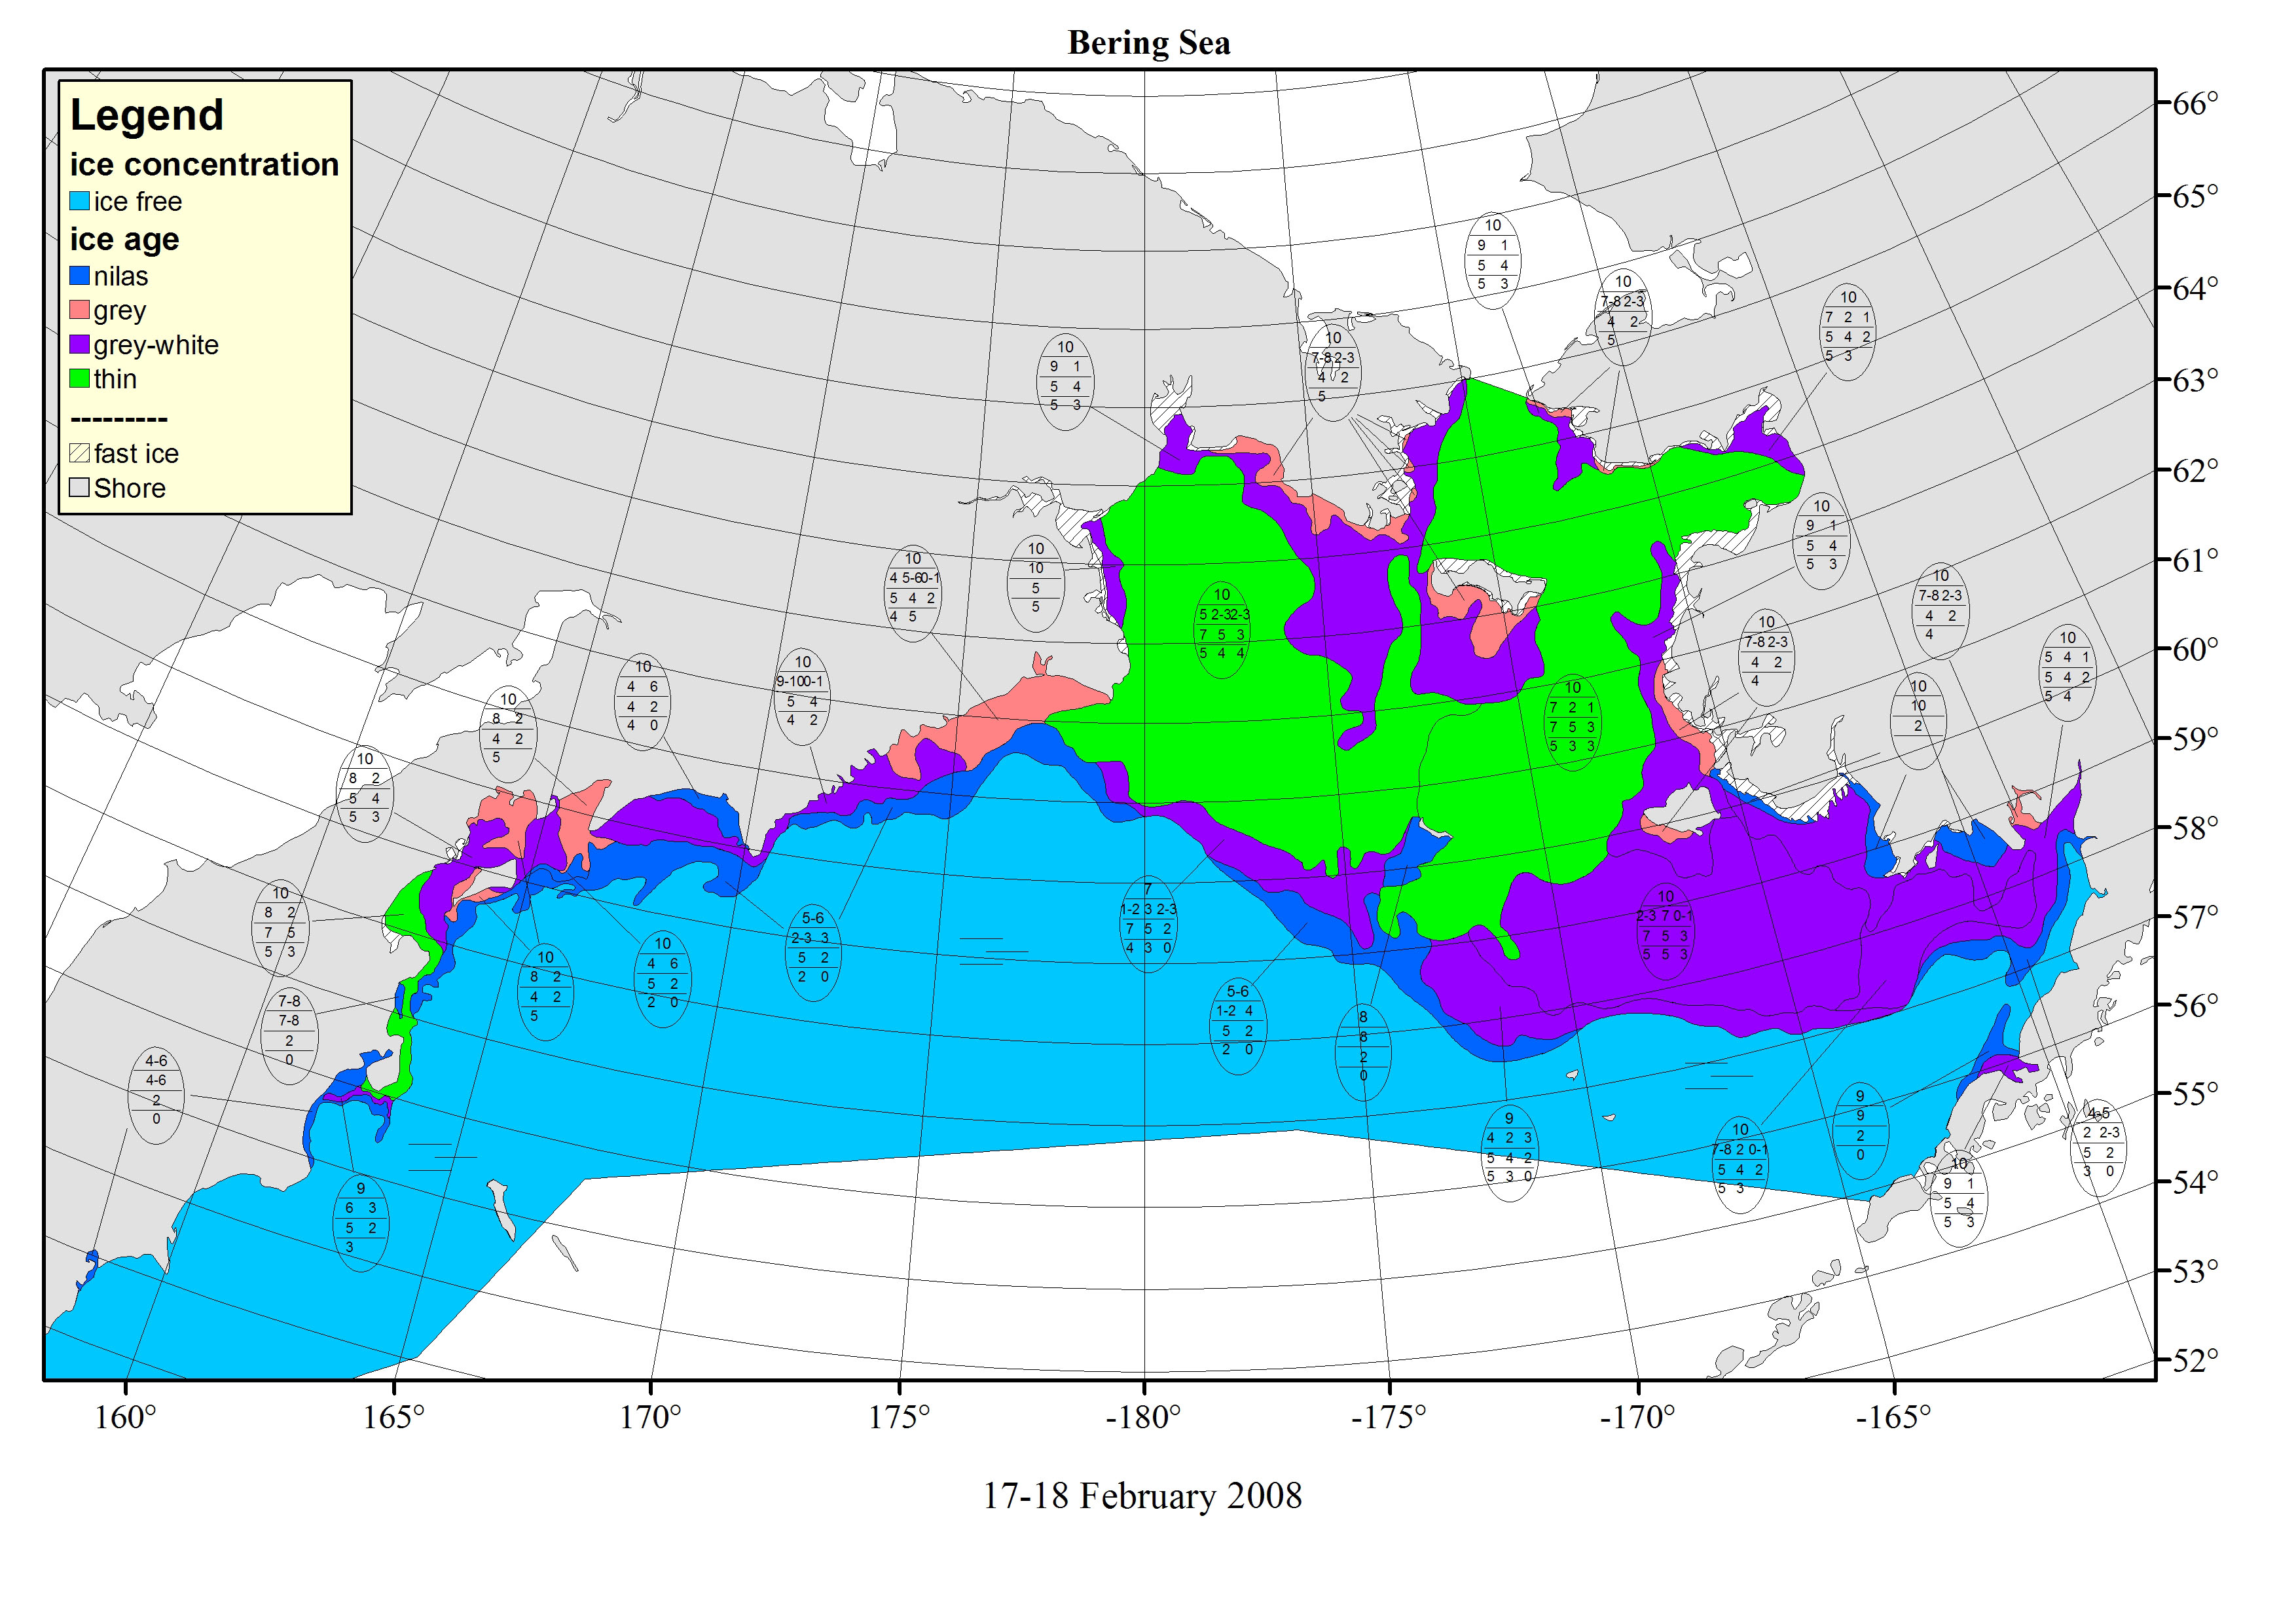
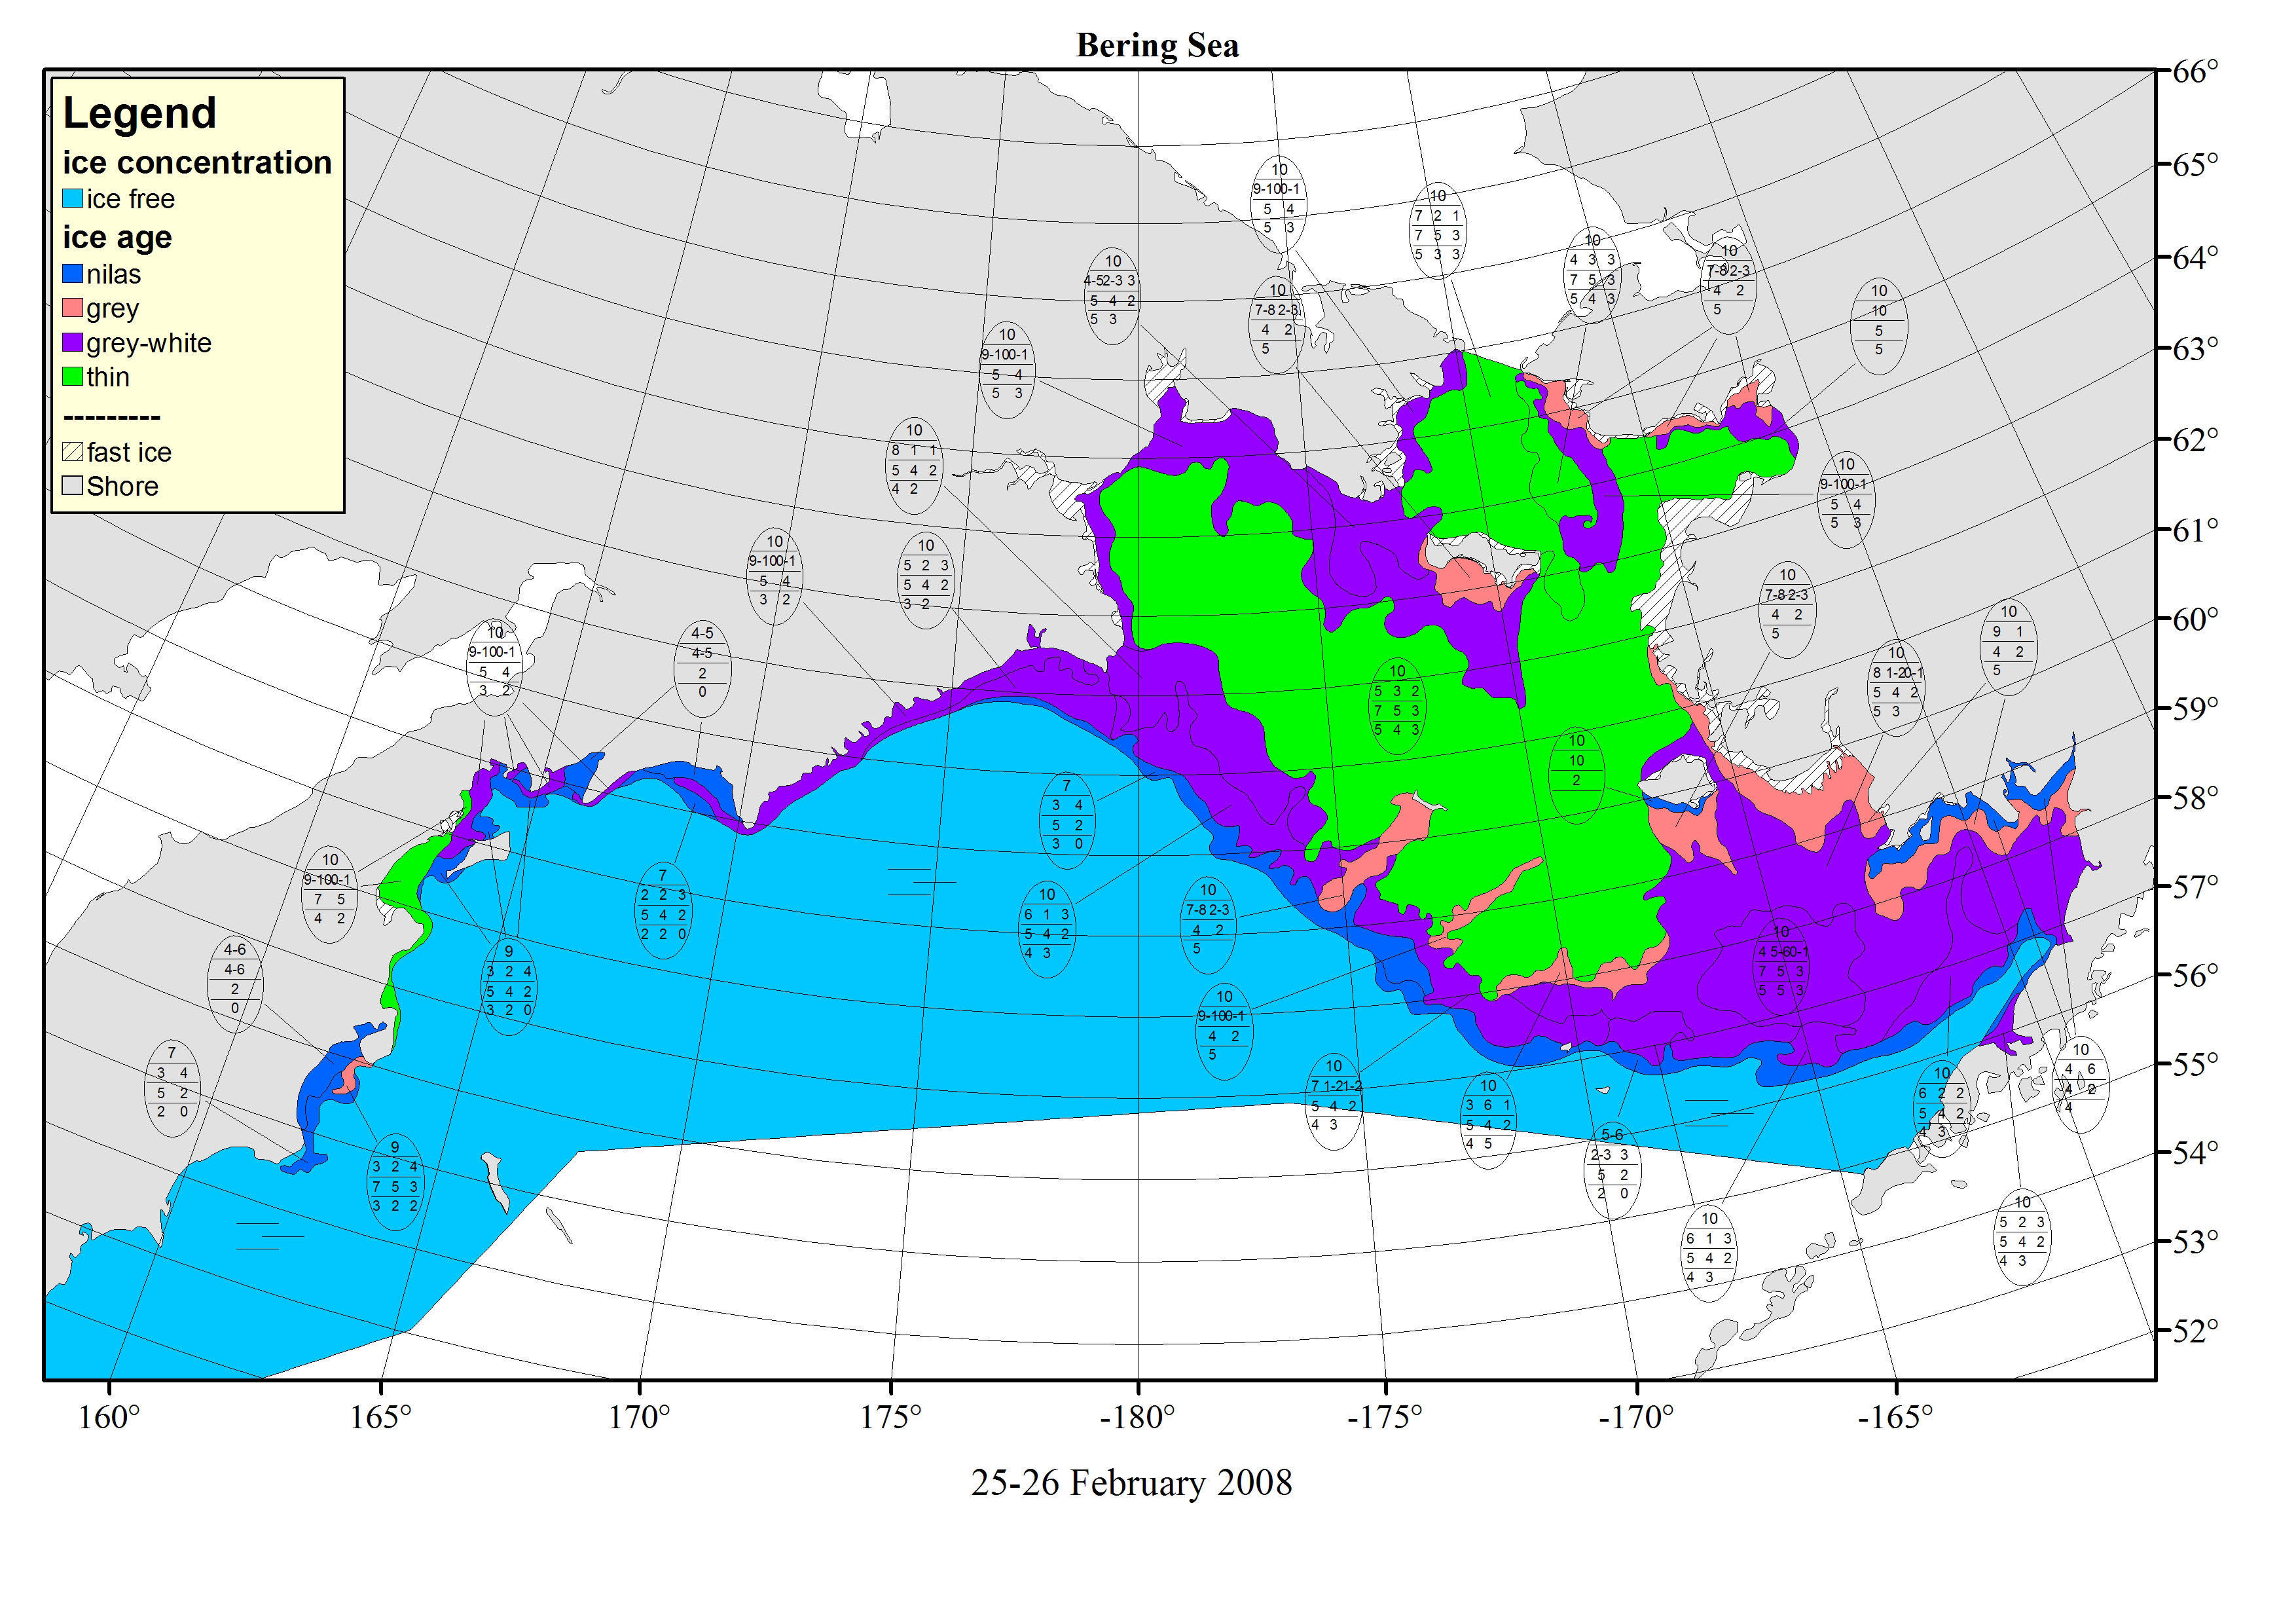
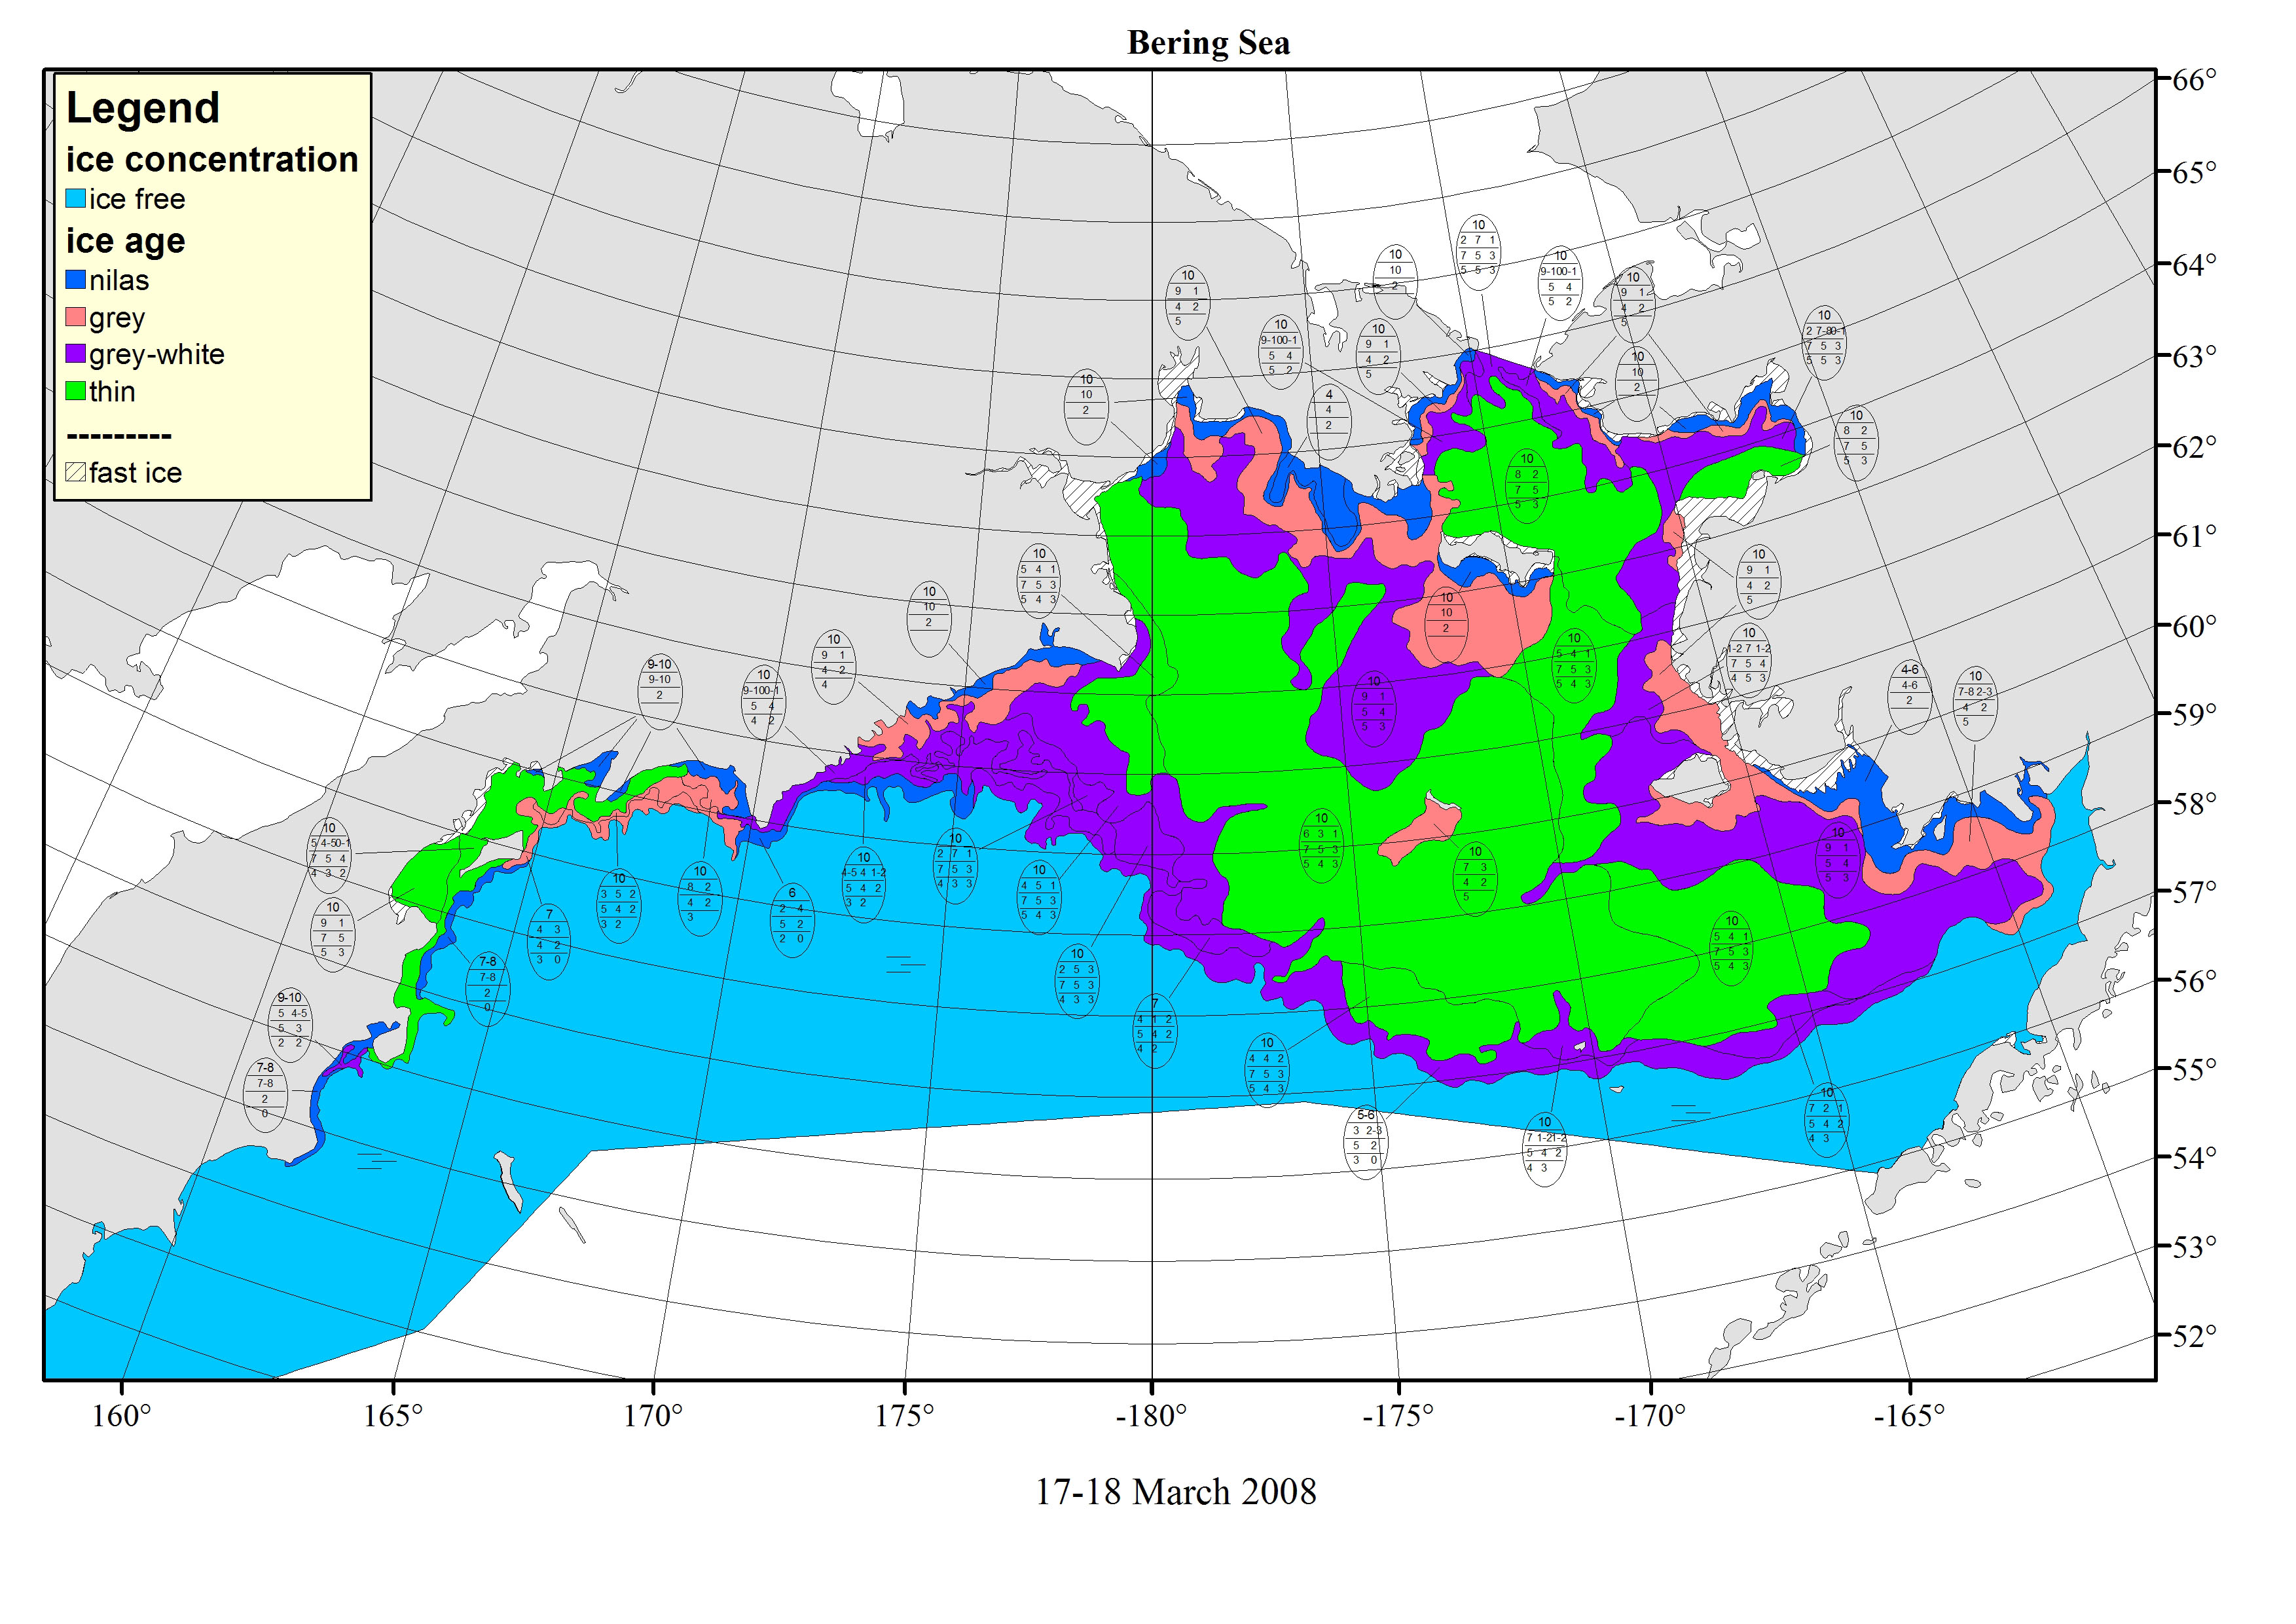
| 1,3 | Bering Sea | 2008-02-17..18 MODIS-AMSR-ENVISAT WSM | Ice boundary, fast ice, young and first-year ice (area heavily covered by clouds) | AARI |
| 2008-03-17-18 MODIS-AMSR | Ice boundary, fast ice, young and first-year ice (area practically free of clouds) | |||
| 2 | Barents Sea & Arctic Basin N of FJL | 2008-04-01..03 NOAA AHHRR ch.3,4&5 (pseudo-colors) | Ice boundary, first-year ice, leads | AARI |
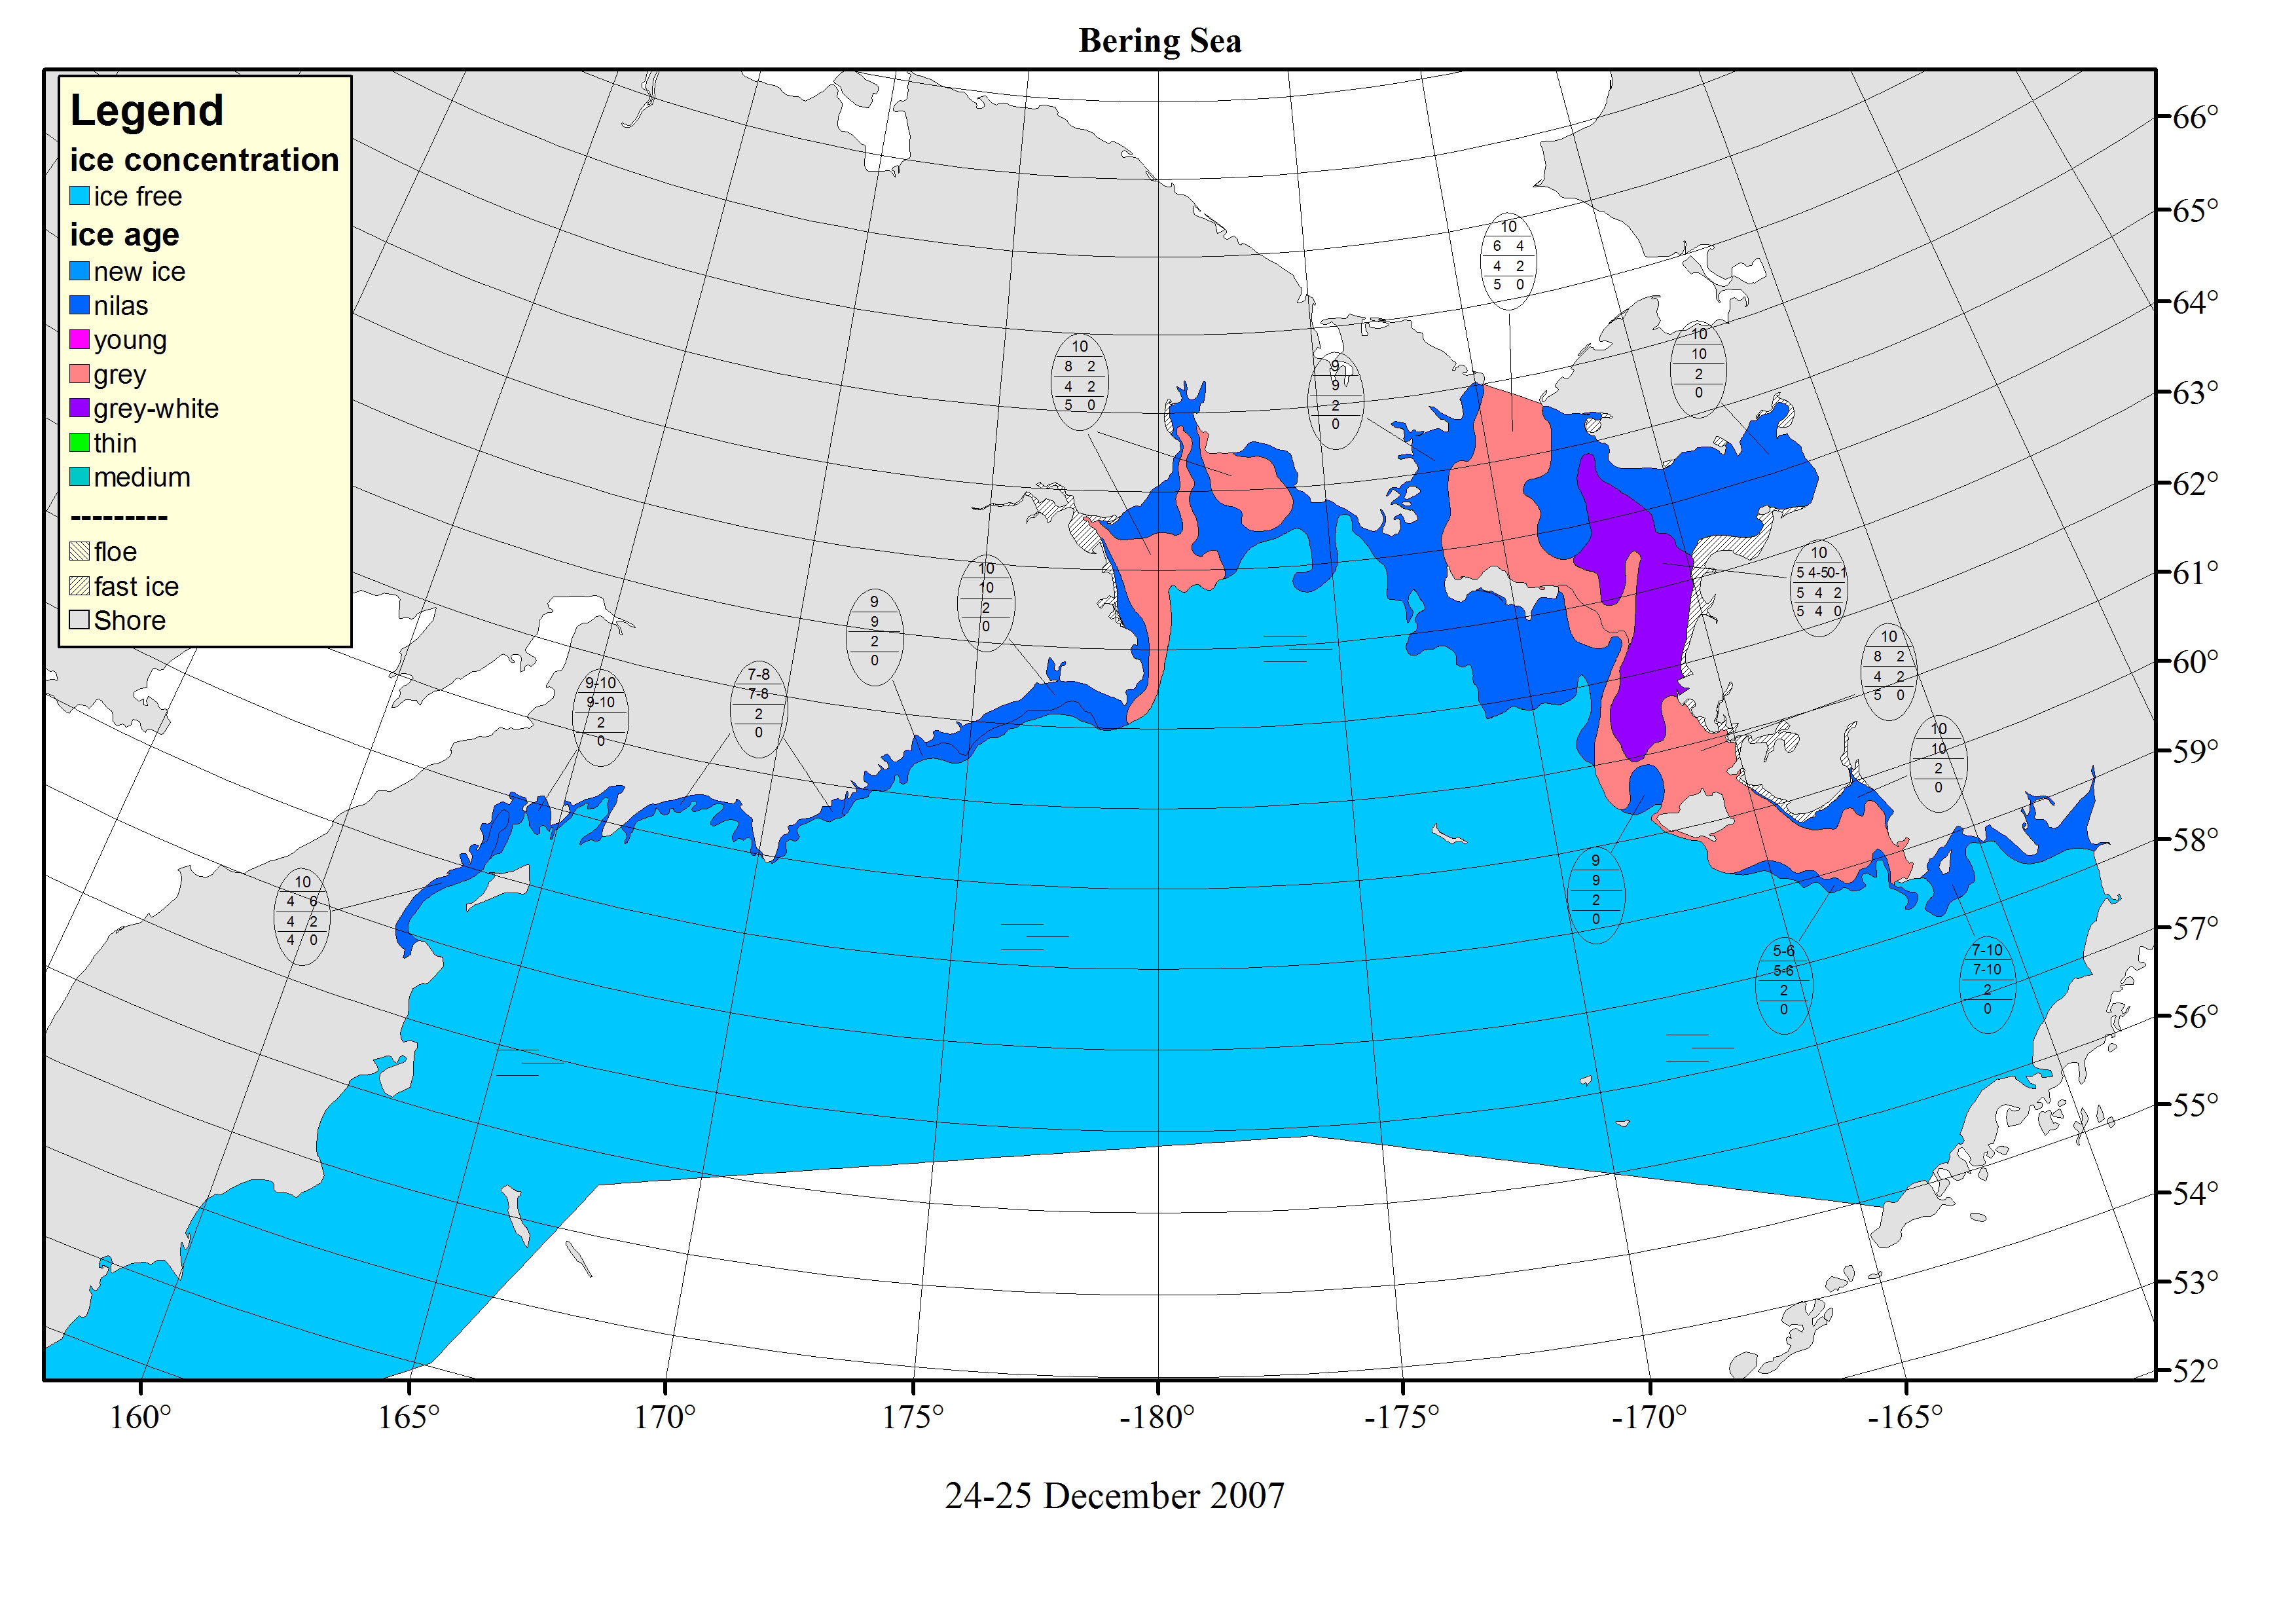
| 3 | Bering Sea | Routine ice charts for: 2007-12-24..25 Chart, AMSR |
Ice boundary, fast ice, young and first-year ice | AARI |
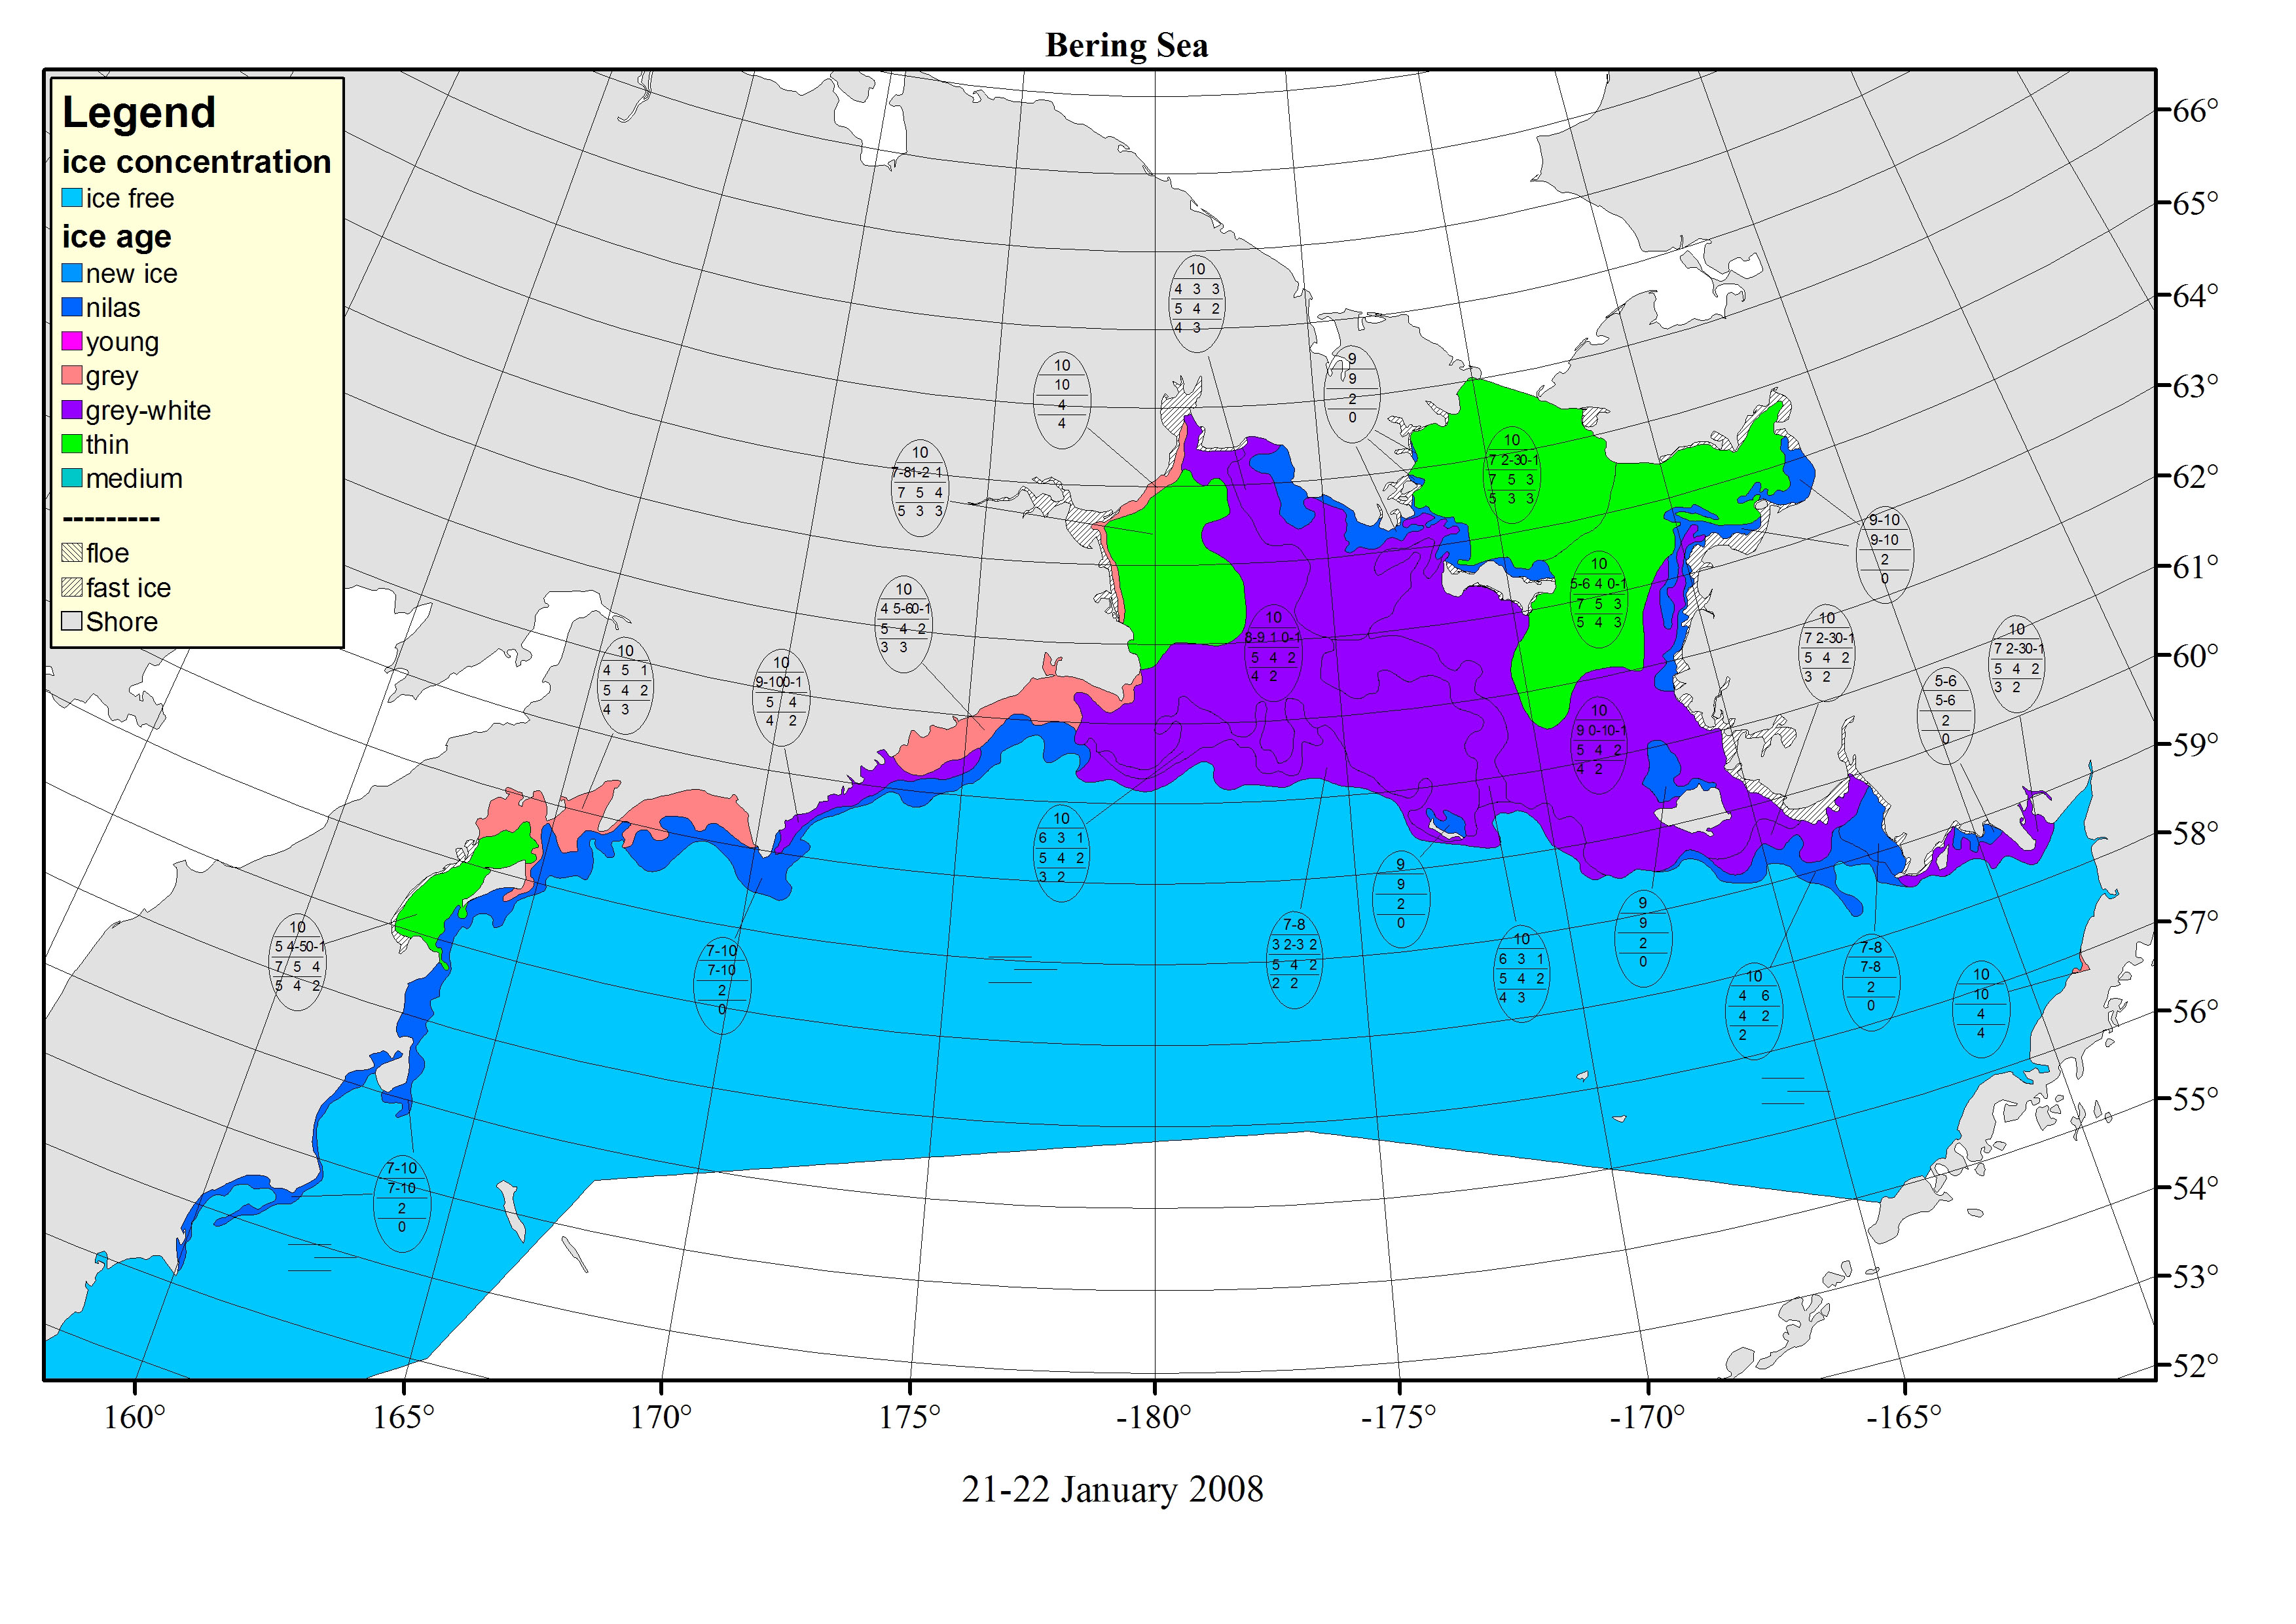
| 2008-01-21..22 Chart, AMSR | ||||
| 2008-02-17..18 Chart, AMSR | ||||
| 2008-02-25..26 Chart, AMSR and | ||||
| 2008-03-17..18 Chart, AMSR | ||||
| 1,3 | Sea of Okhotsk | 2008-02-10 23:32UTC and 2008-02-11 02:32UTC MTSAT Visible | Ice boundary, concentration (partially covered with clouds) |
JMA |
| 2008-02-10 23:12UTC and 2008-02-11 01:43UTC NOAA AVHRR CH1,2 and 4 composite image | ||||
| Sea ice condition chart for 2008-02-11, AMSR | ||||
| 3 | Sea of Okhotsk | Sea ice condition chart for 2007-12-25 and 2008-01-22 | Ice Boundary, concentration | JMA |
Baltic |
||||
| 4 | Baltic Sea | Historic Ice charts from different ice services at two dates, 1.2.1963 and 21.3.1988 (Scanned maps available below. ) | Ice boundary, concentration and form of ice, ice thickness | BSH |
| 3,4 | Baltic Sea | Ice charts from the actual season with corresponding input data (in situ observations, satelite data, etc). Individual data available below. | Ice boundary, concentration and form of ice, ice thickness | BSIS |
| 2 | ||||
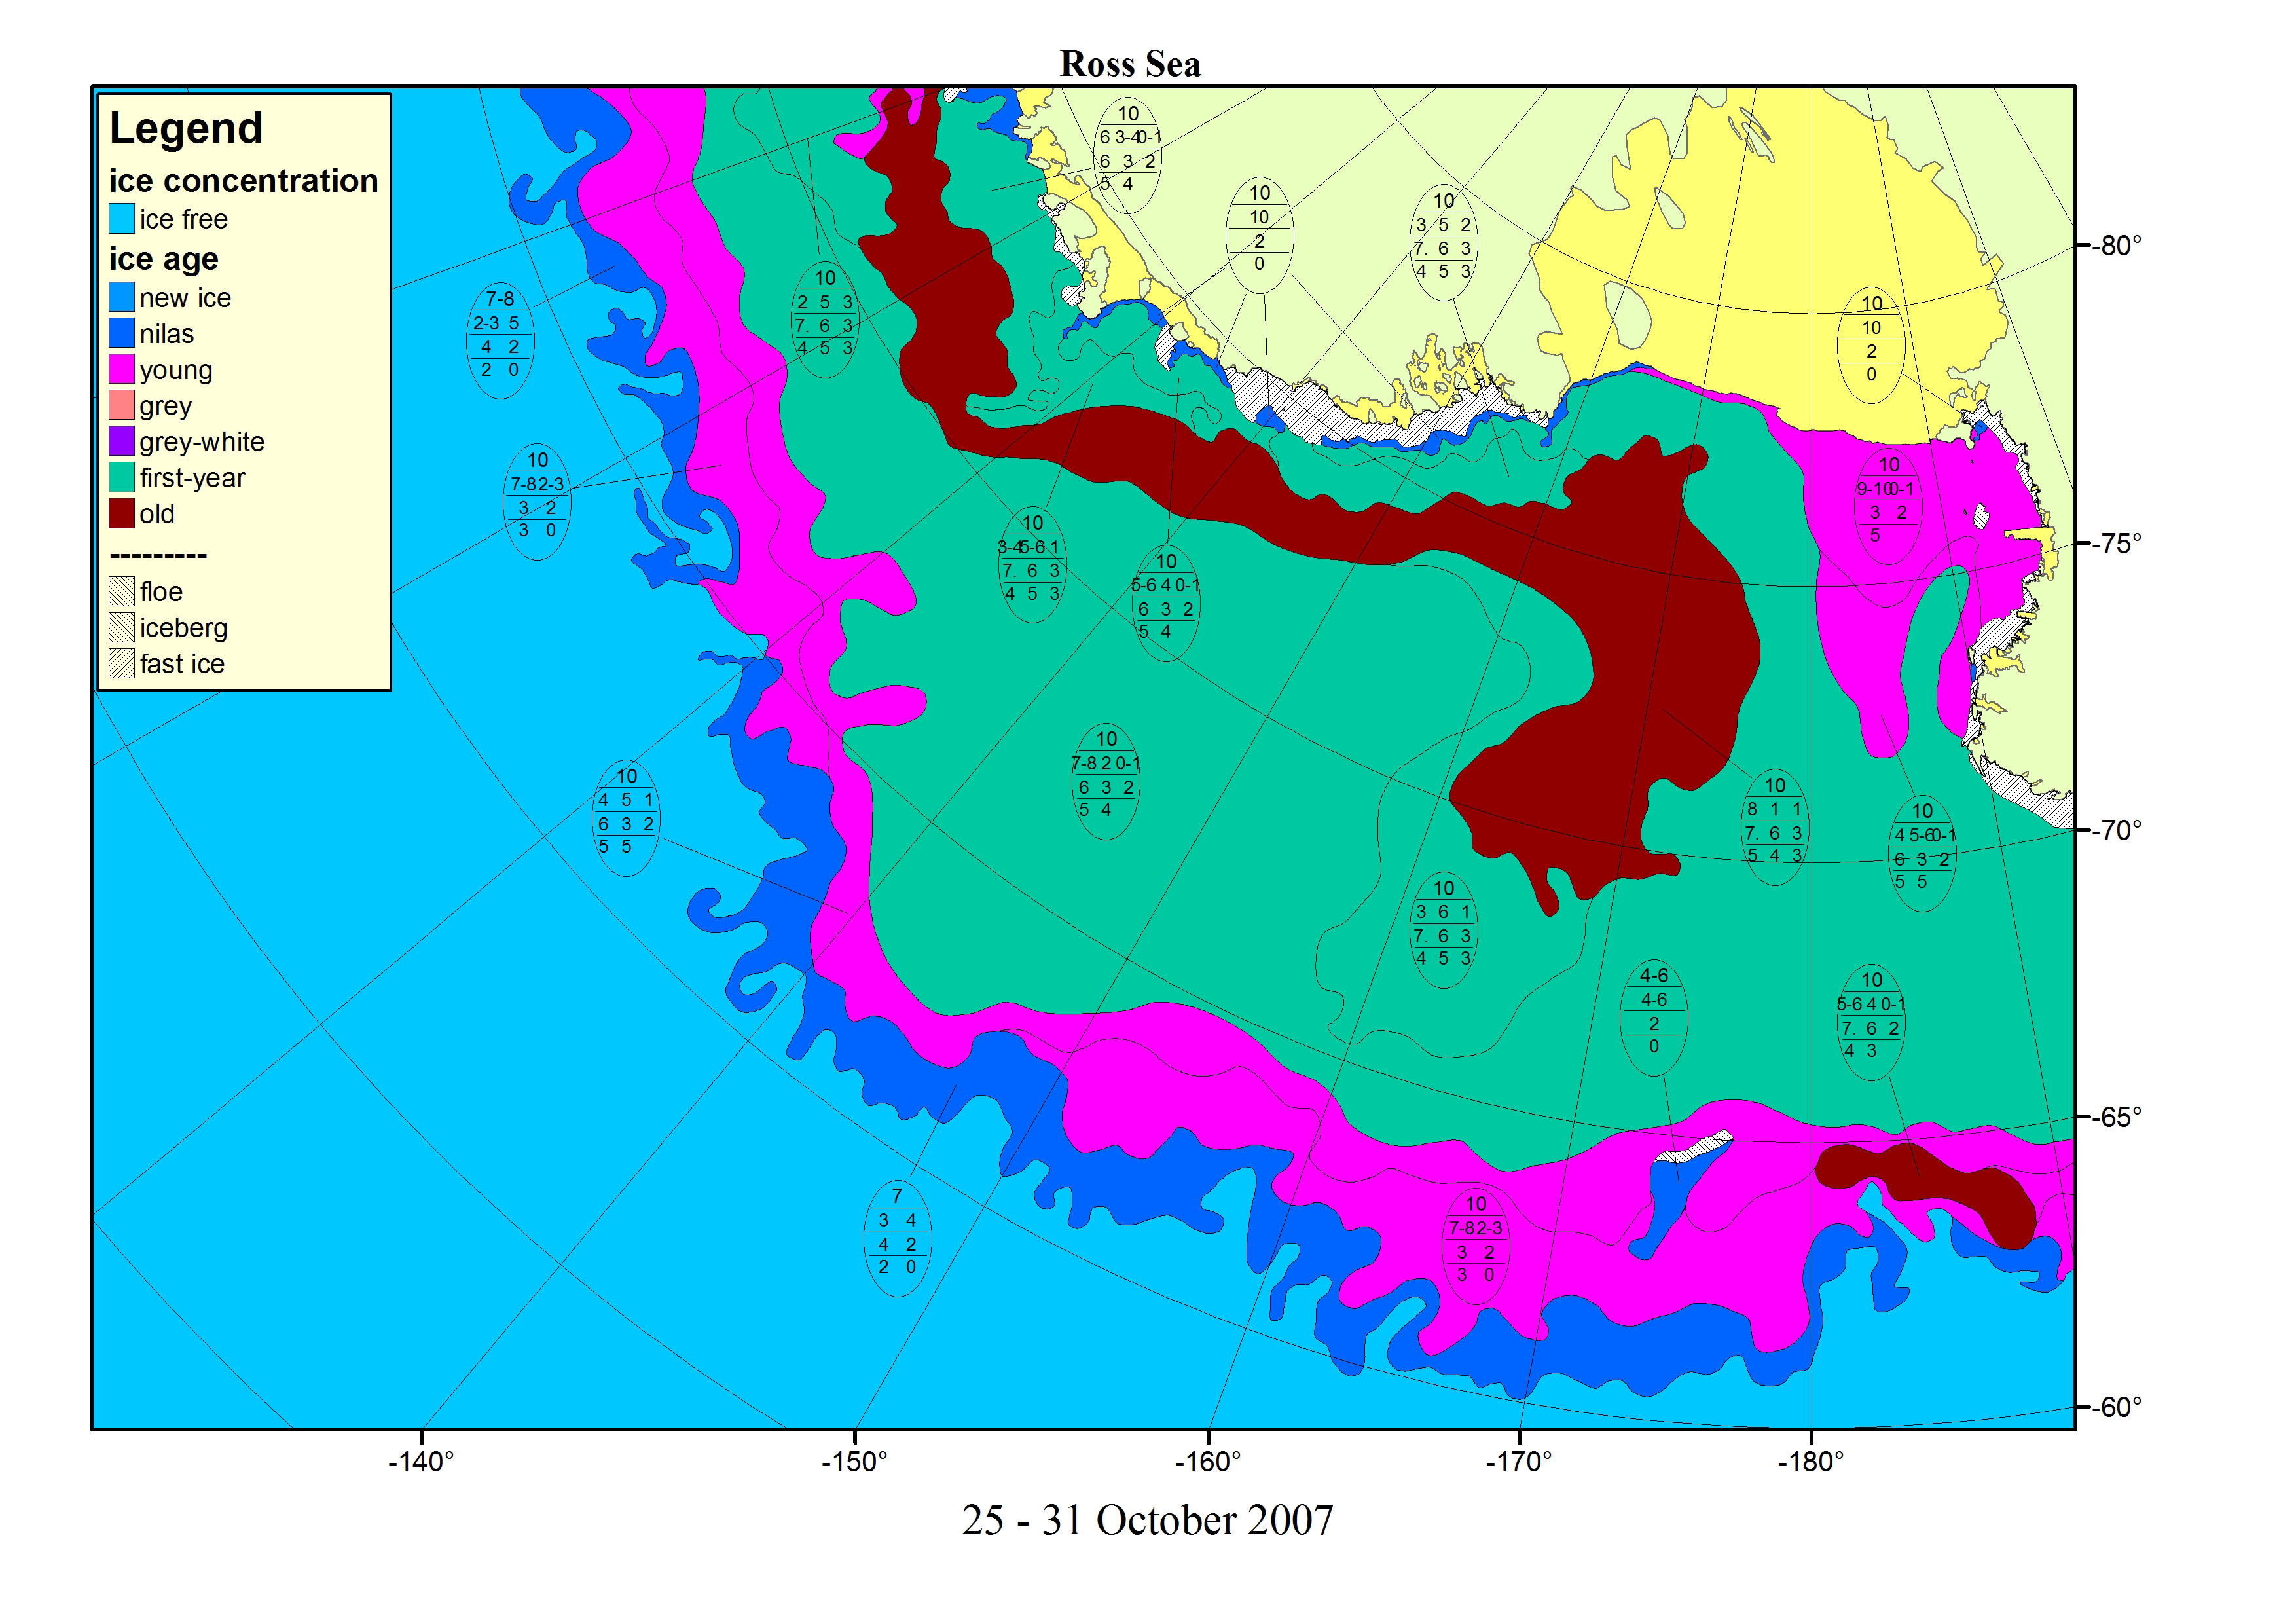
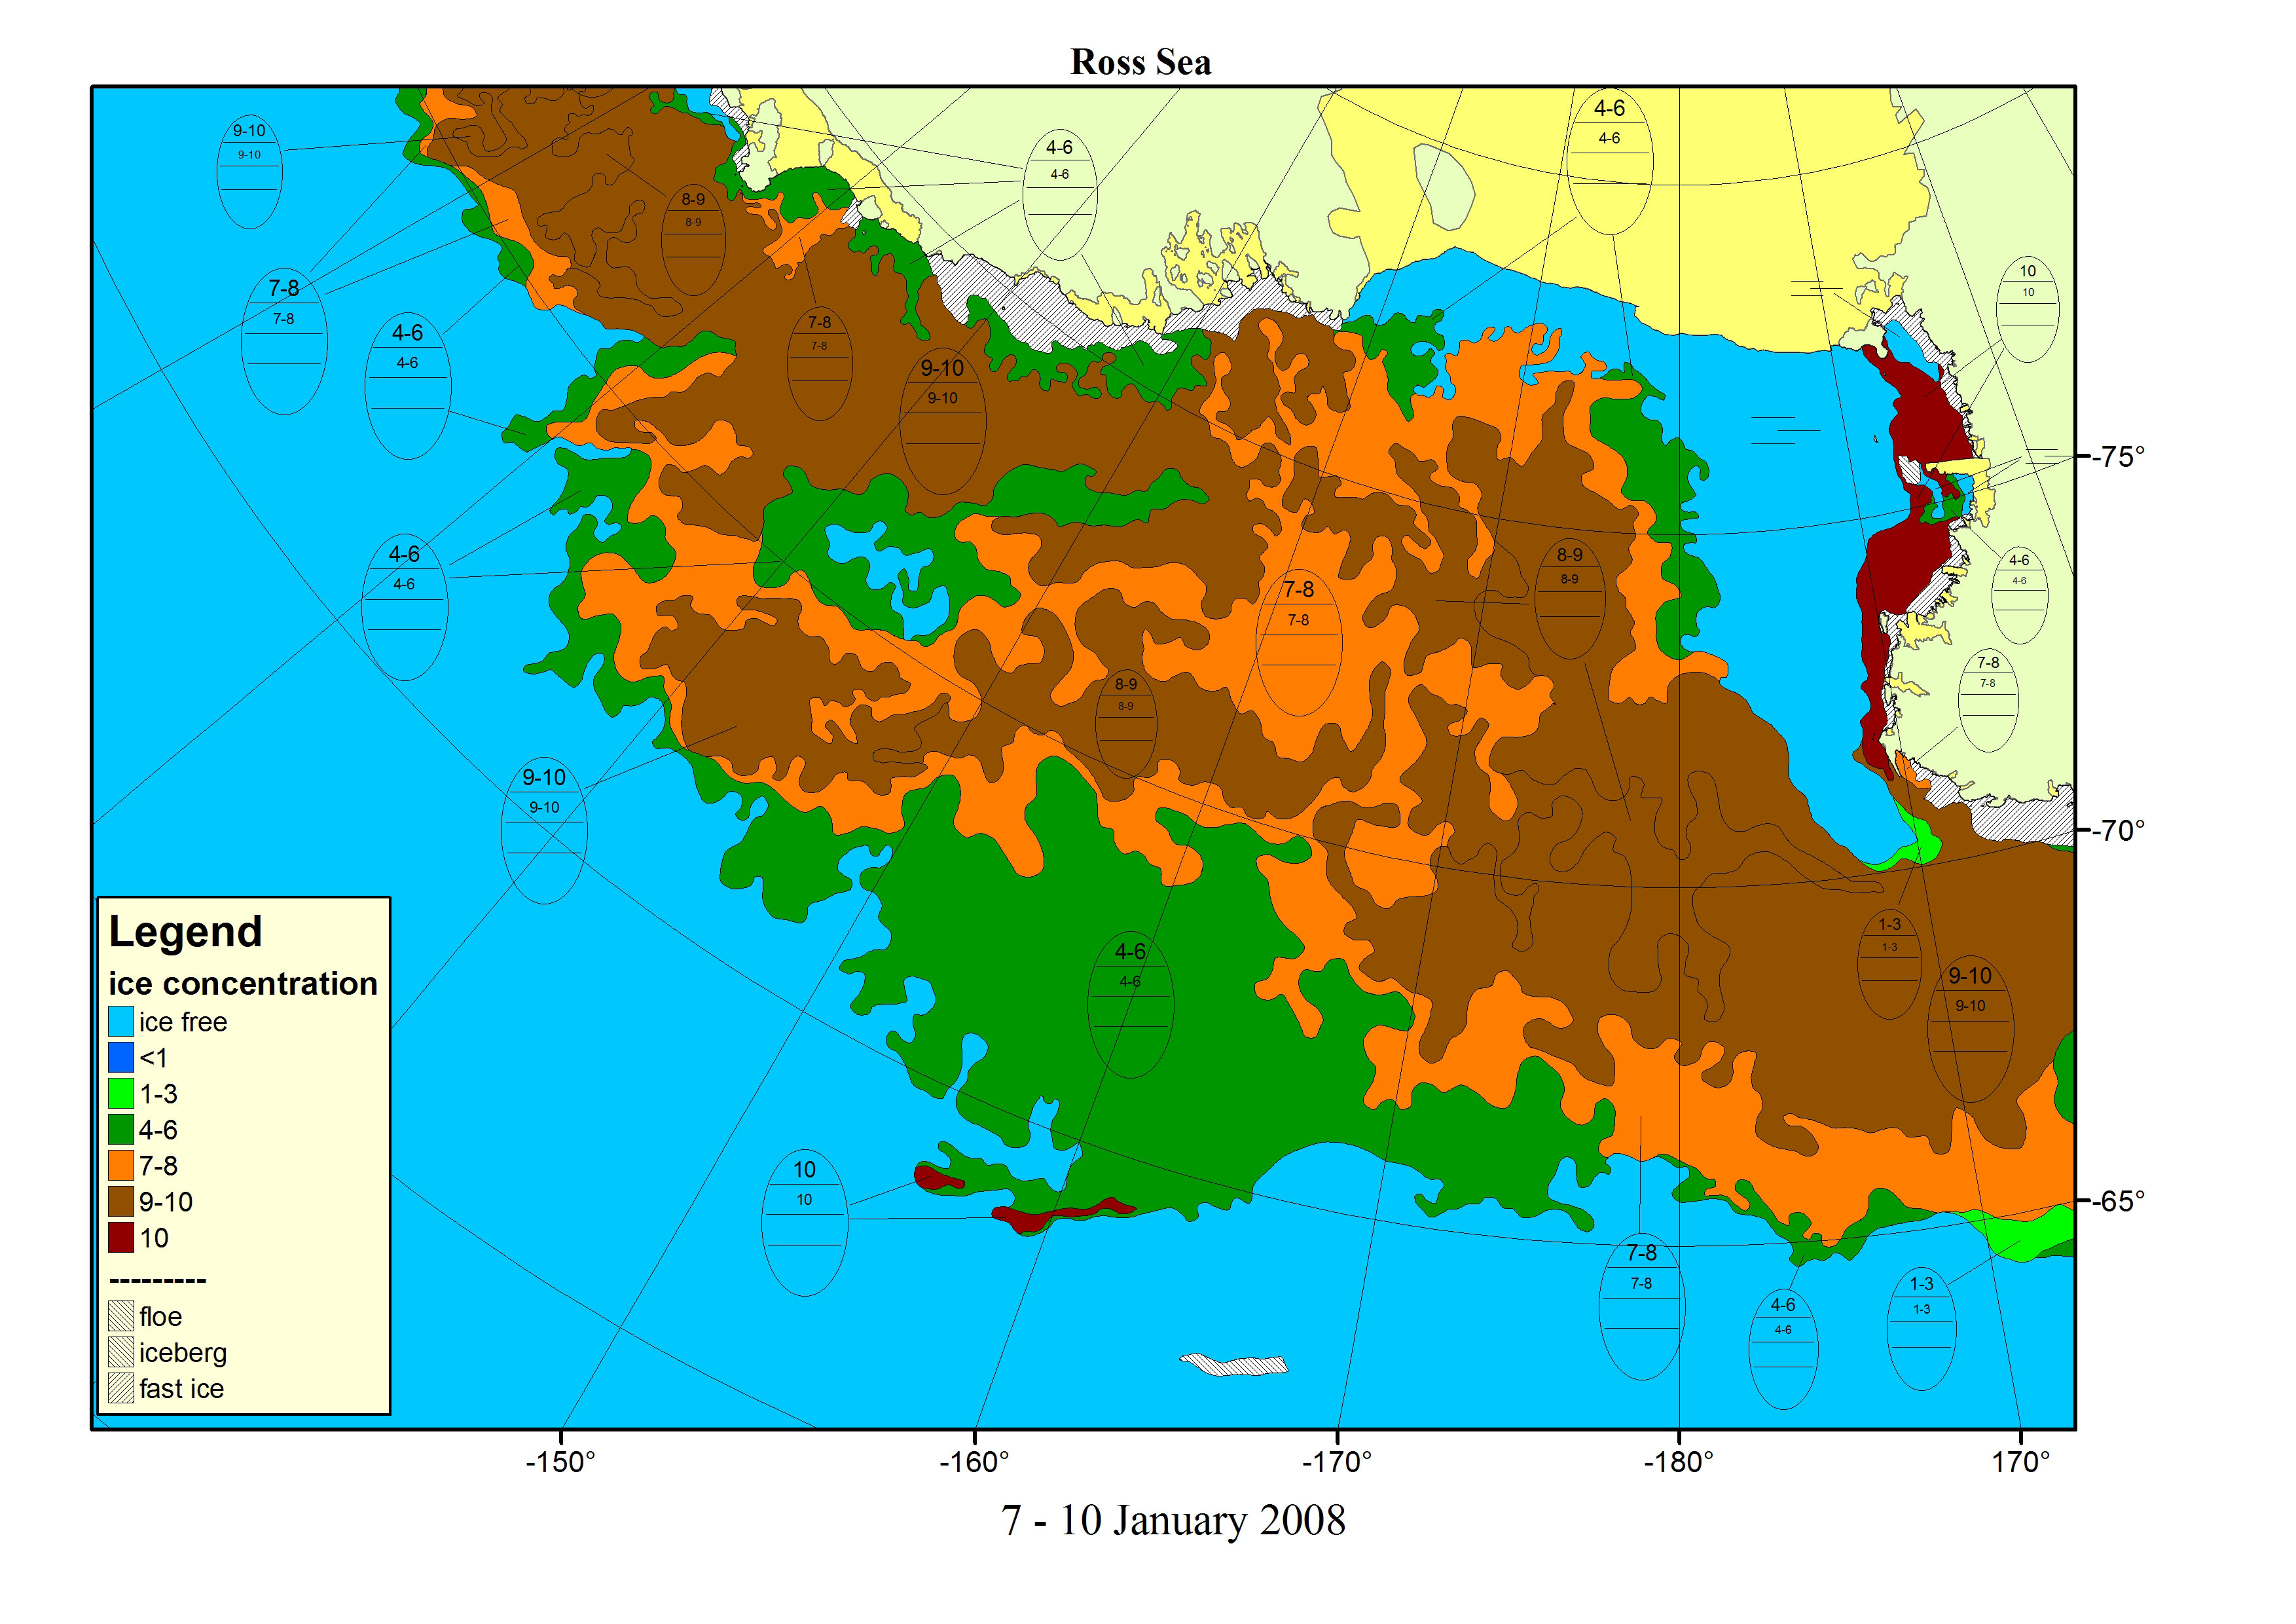
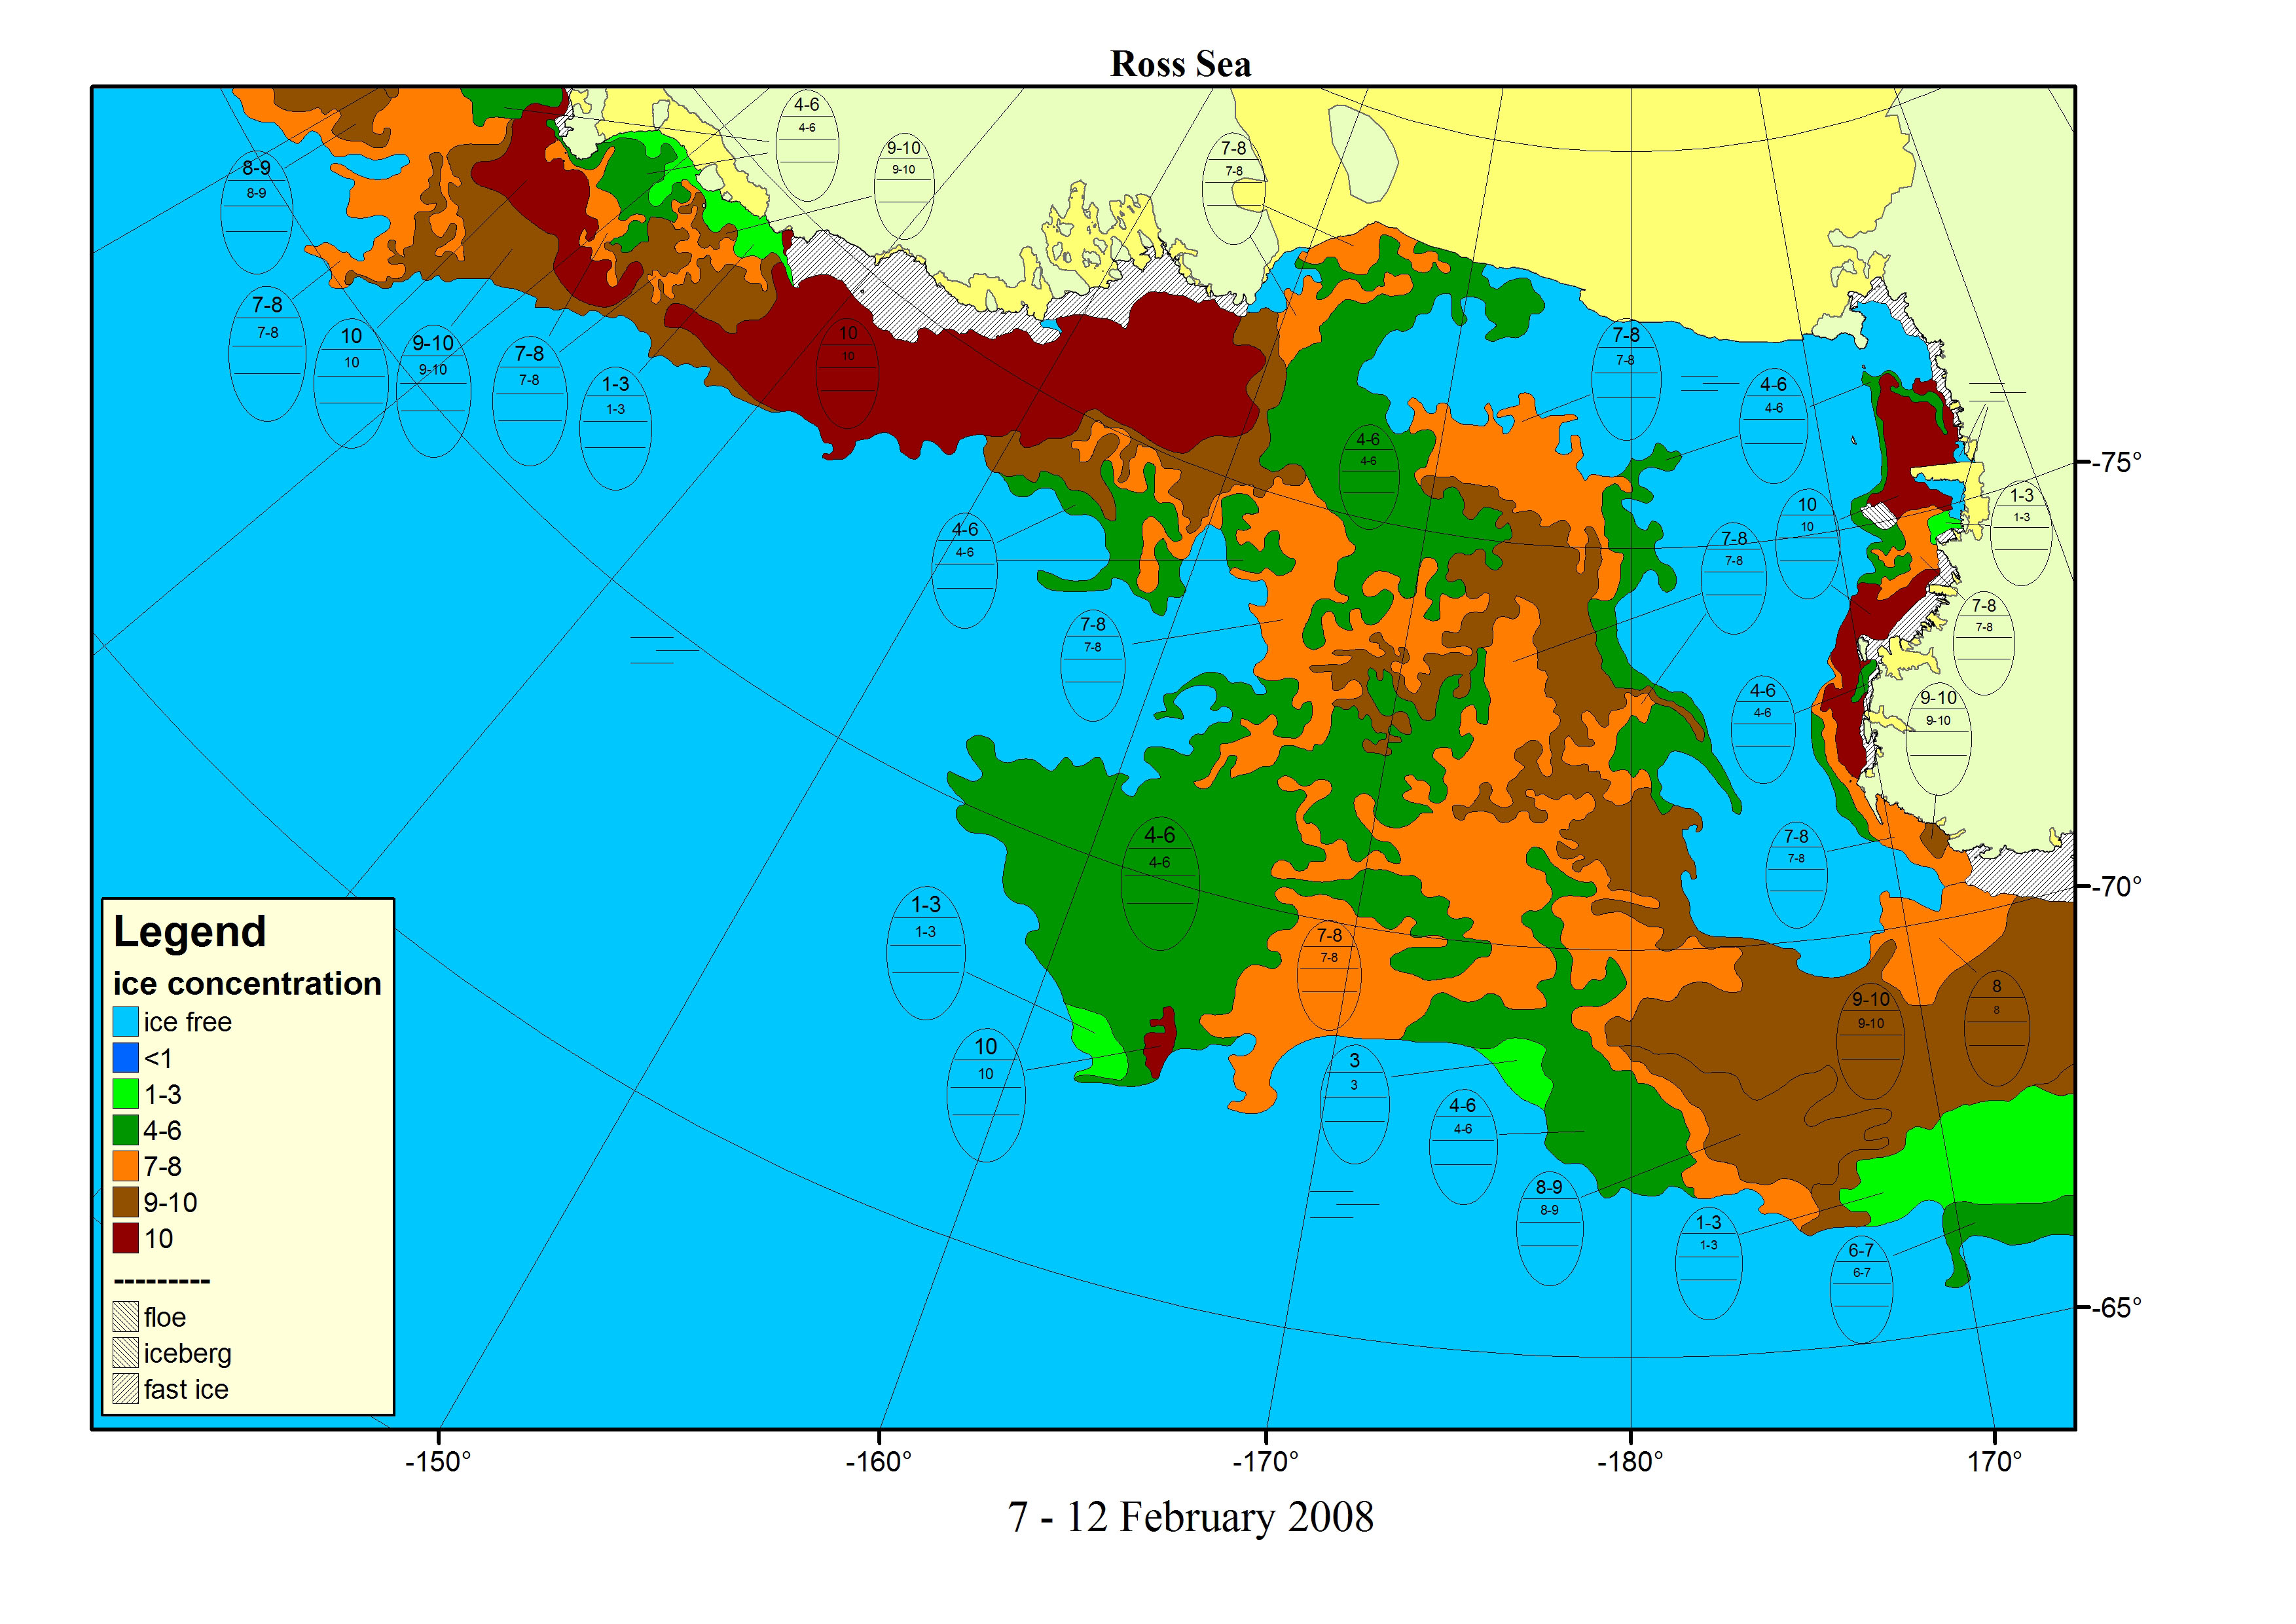
| 1, 3 | Ross Seas |
2007-10-25..31 Chart,
data,
AMSR
2008-01-07..10 Chart, data, AMSR 2008-02-07..12 Chart, Chart2, data, AMSR data=MODIS,ENVISAT,GMM-QScat VV |
Ice boundary, total concentration analysis, fast ice detection | AARI |
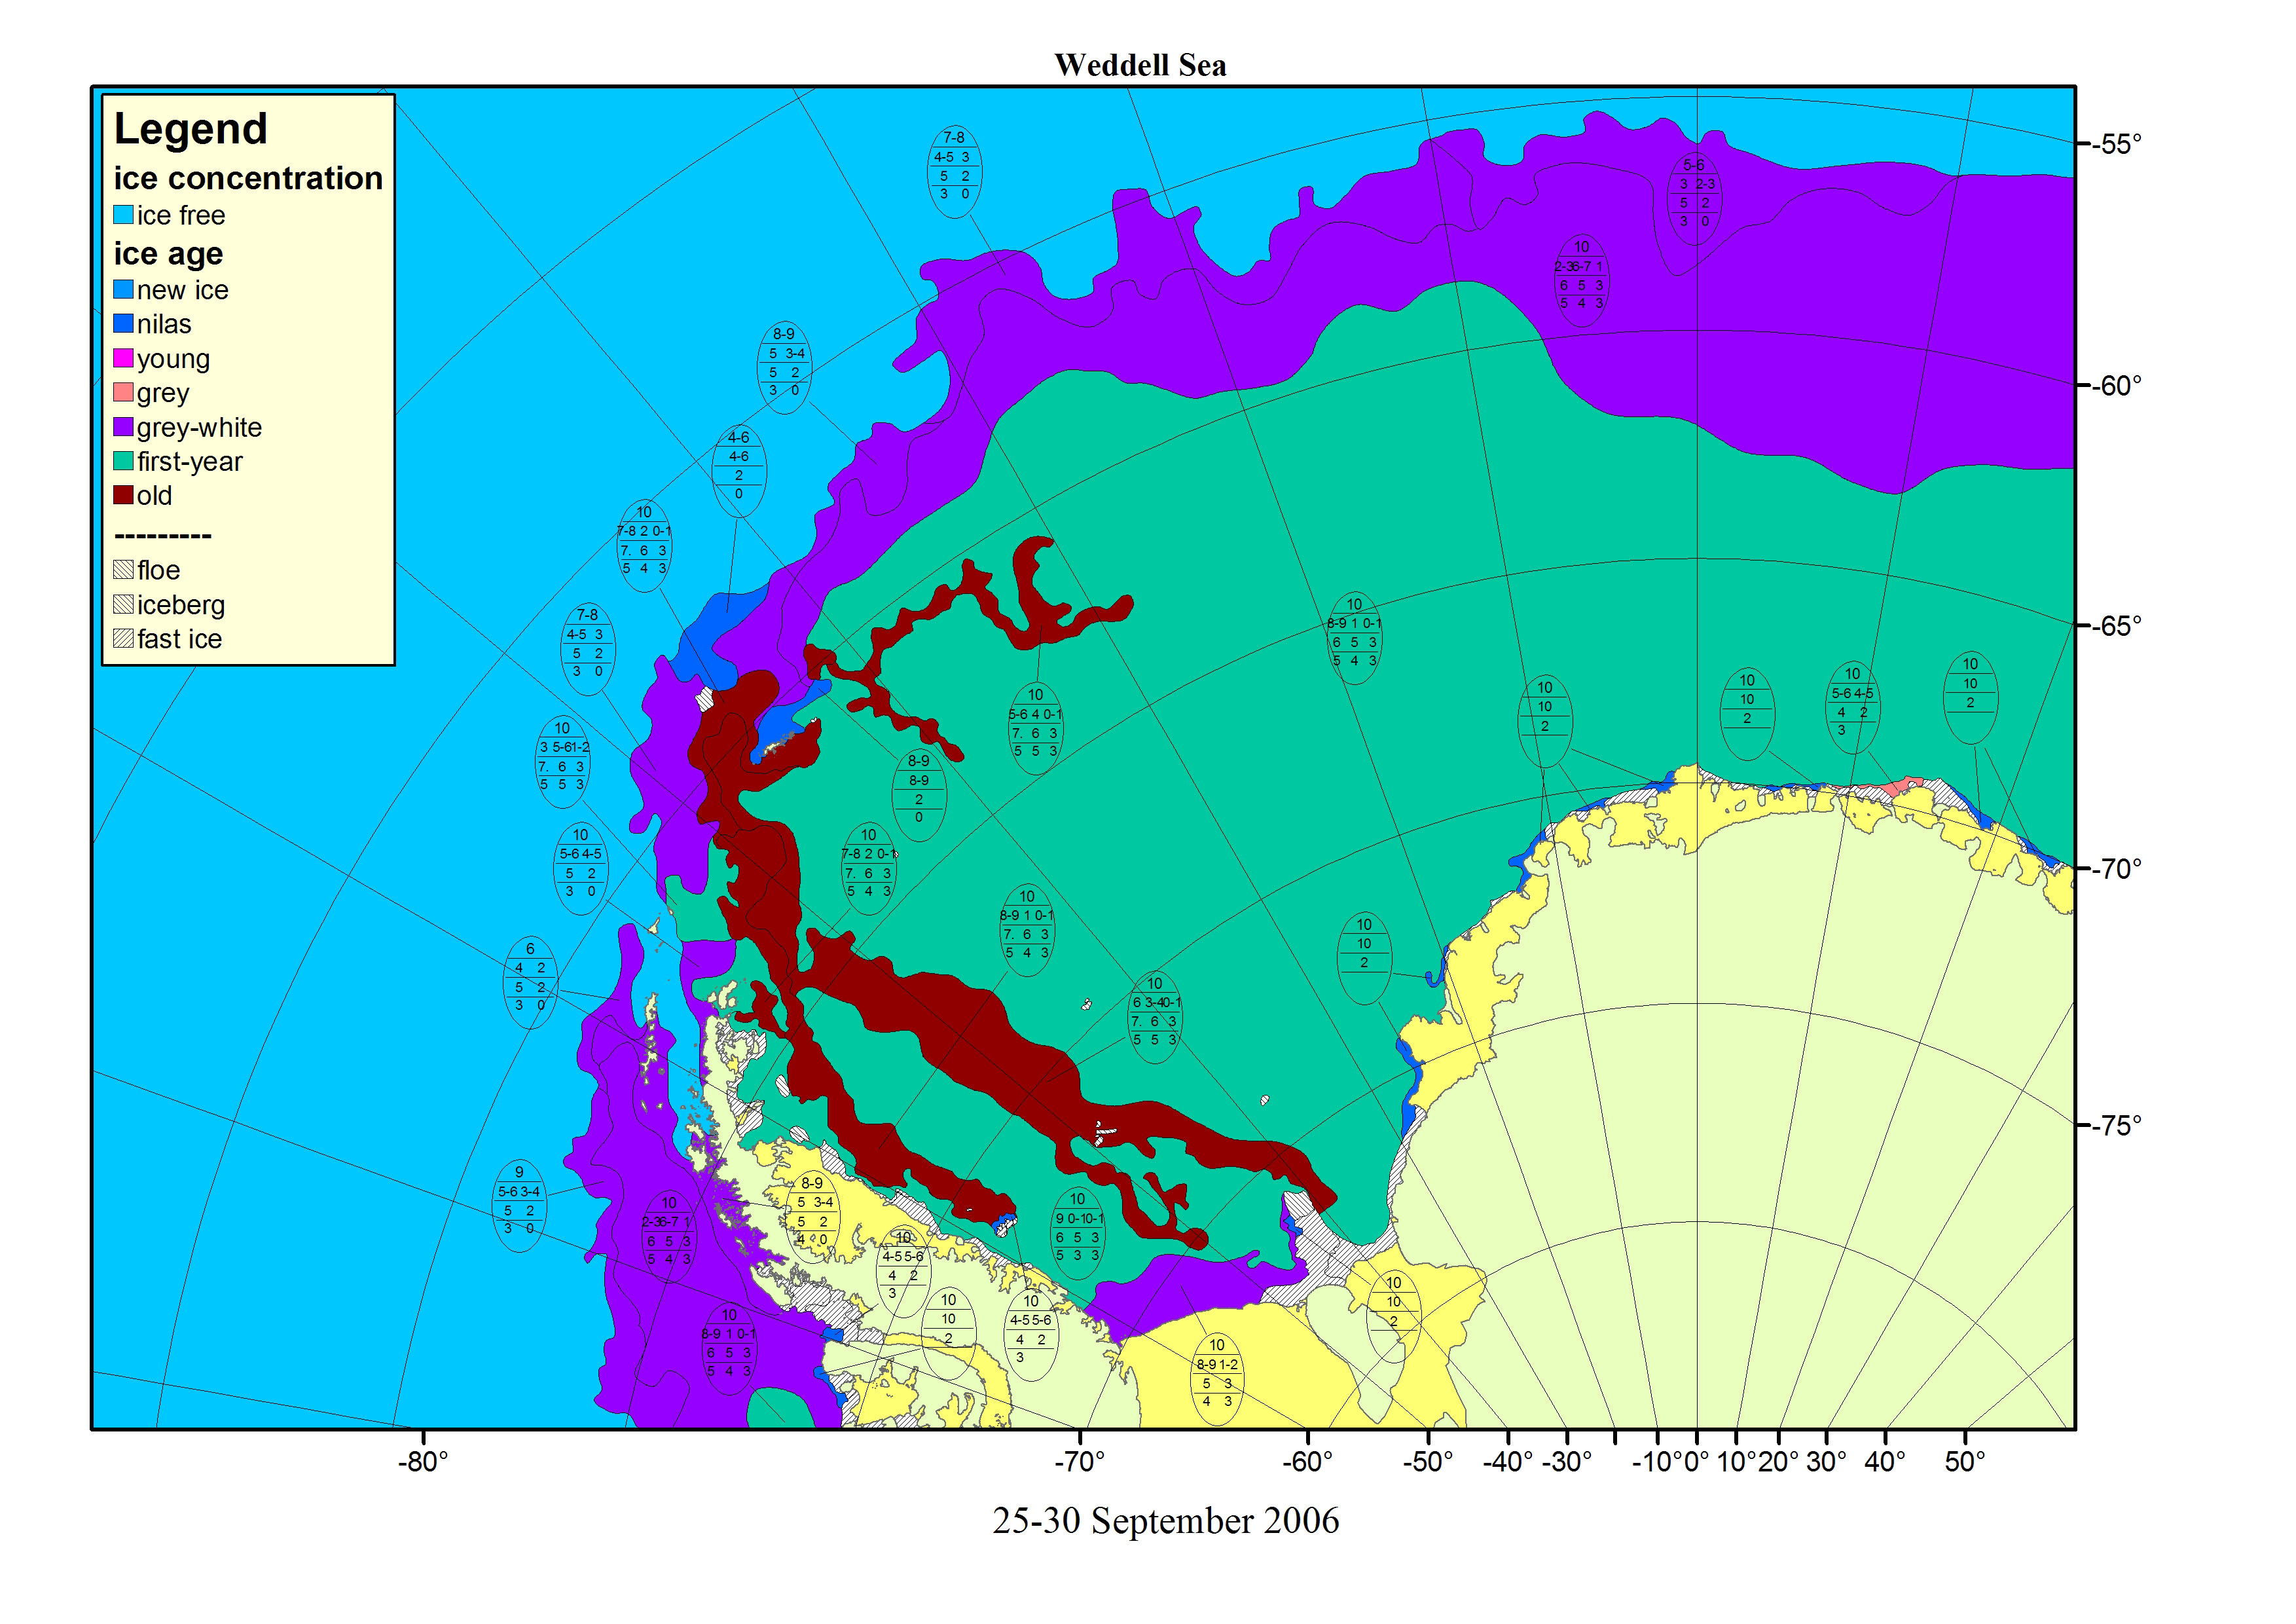
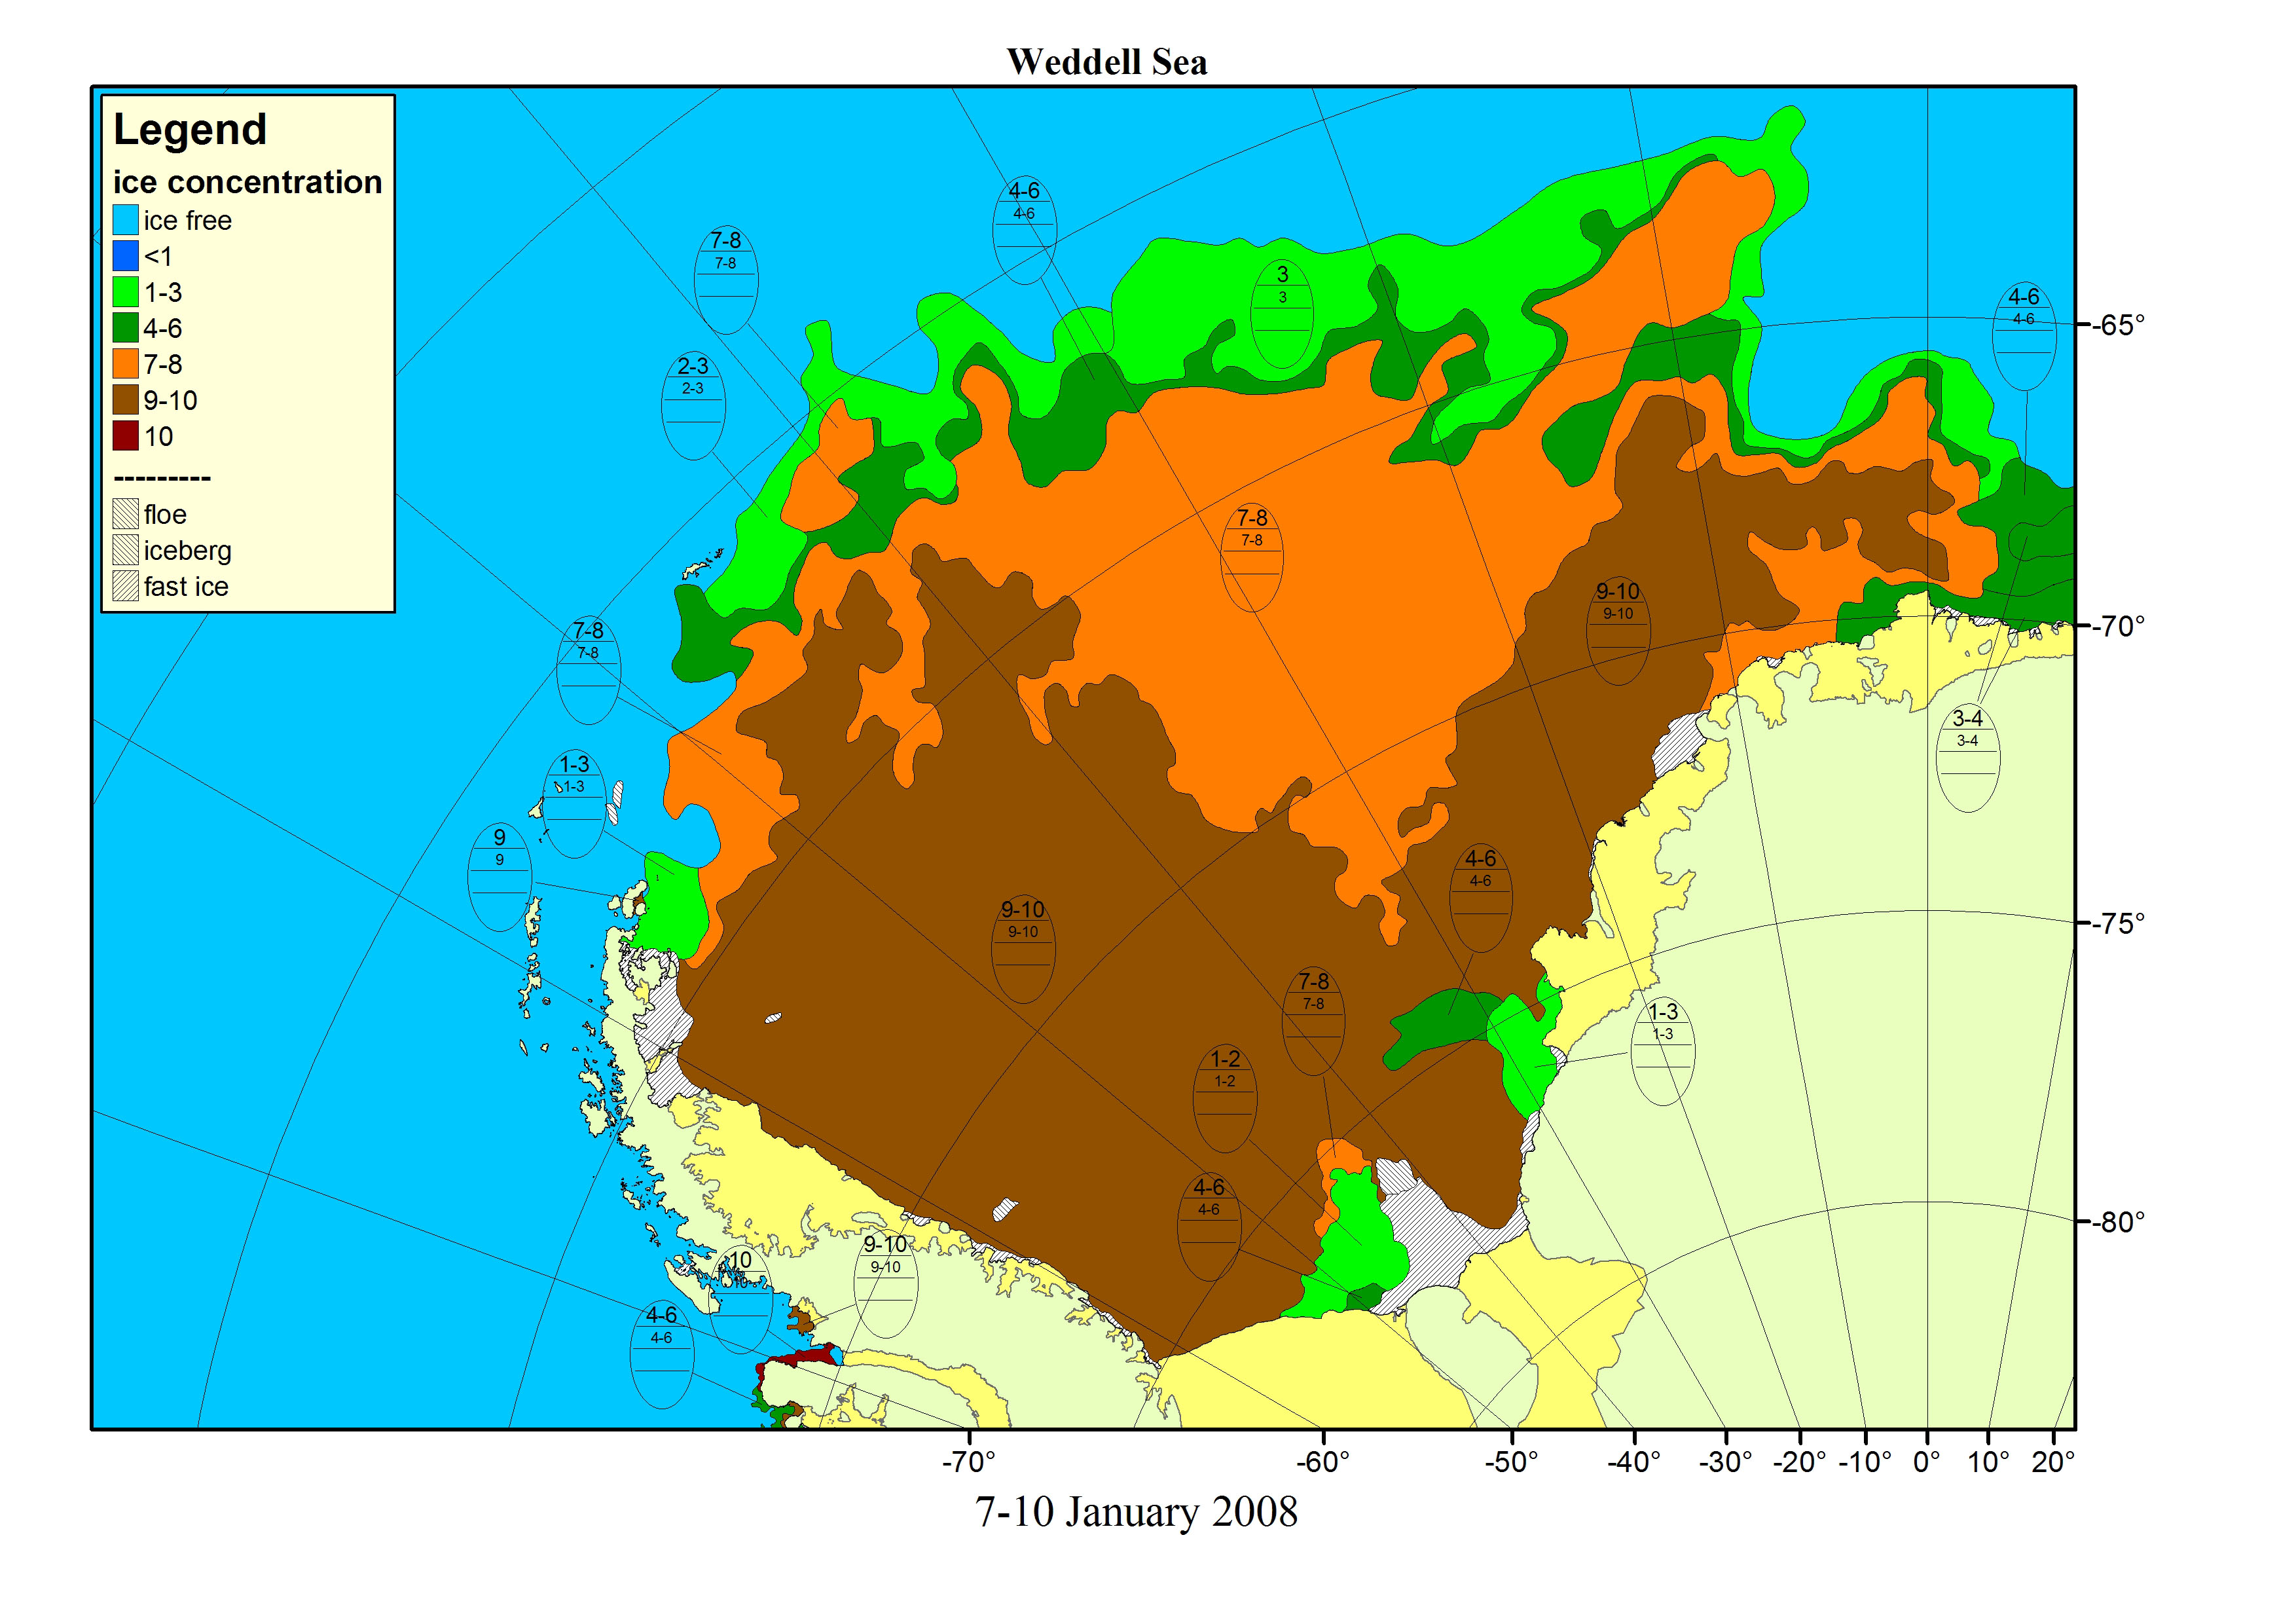
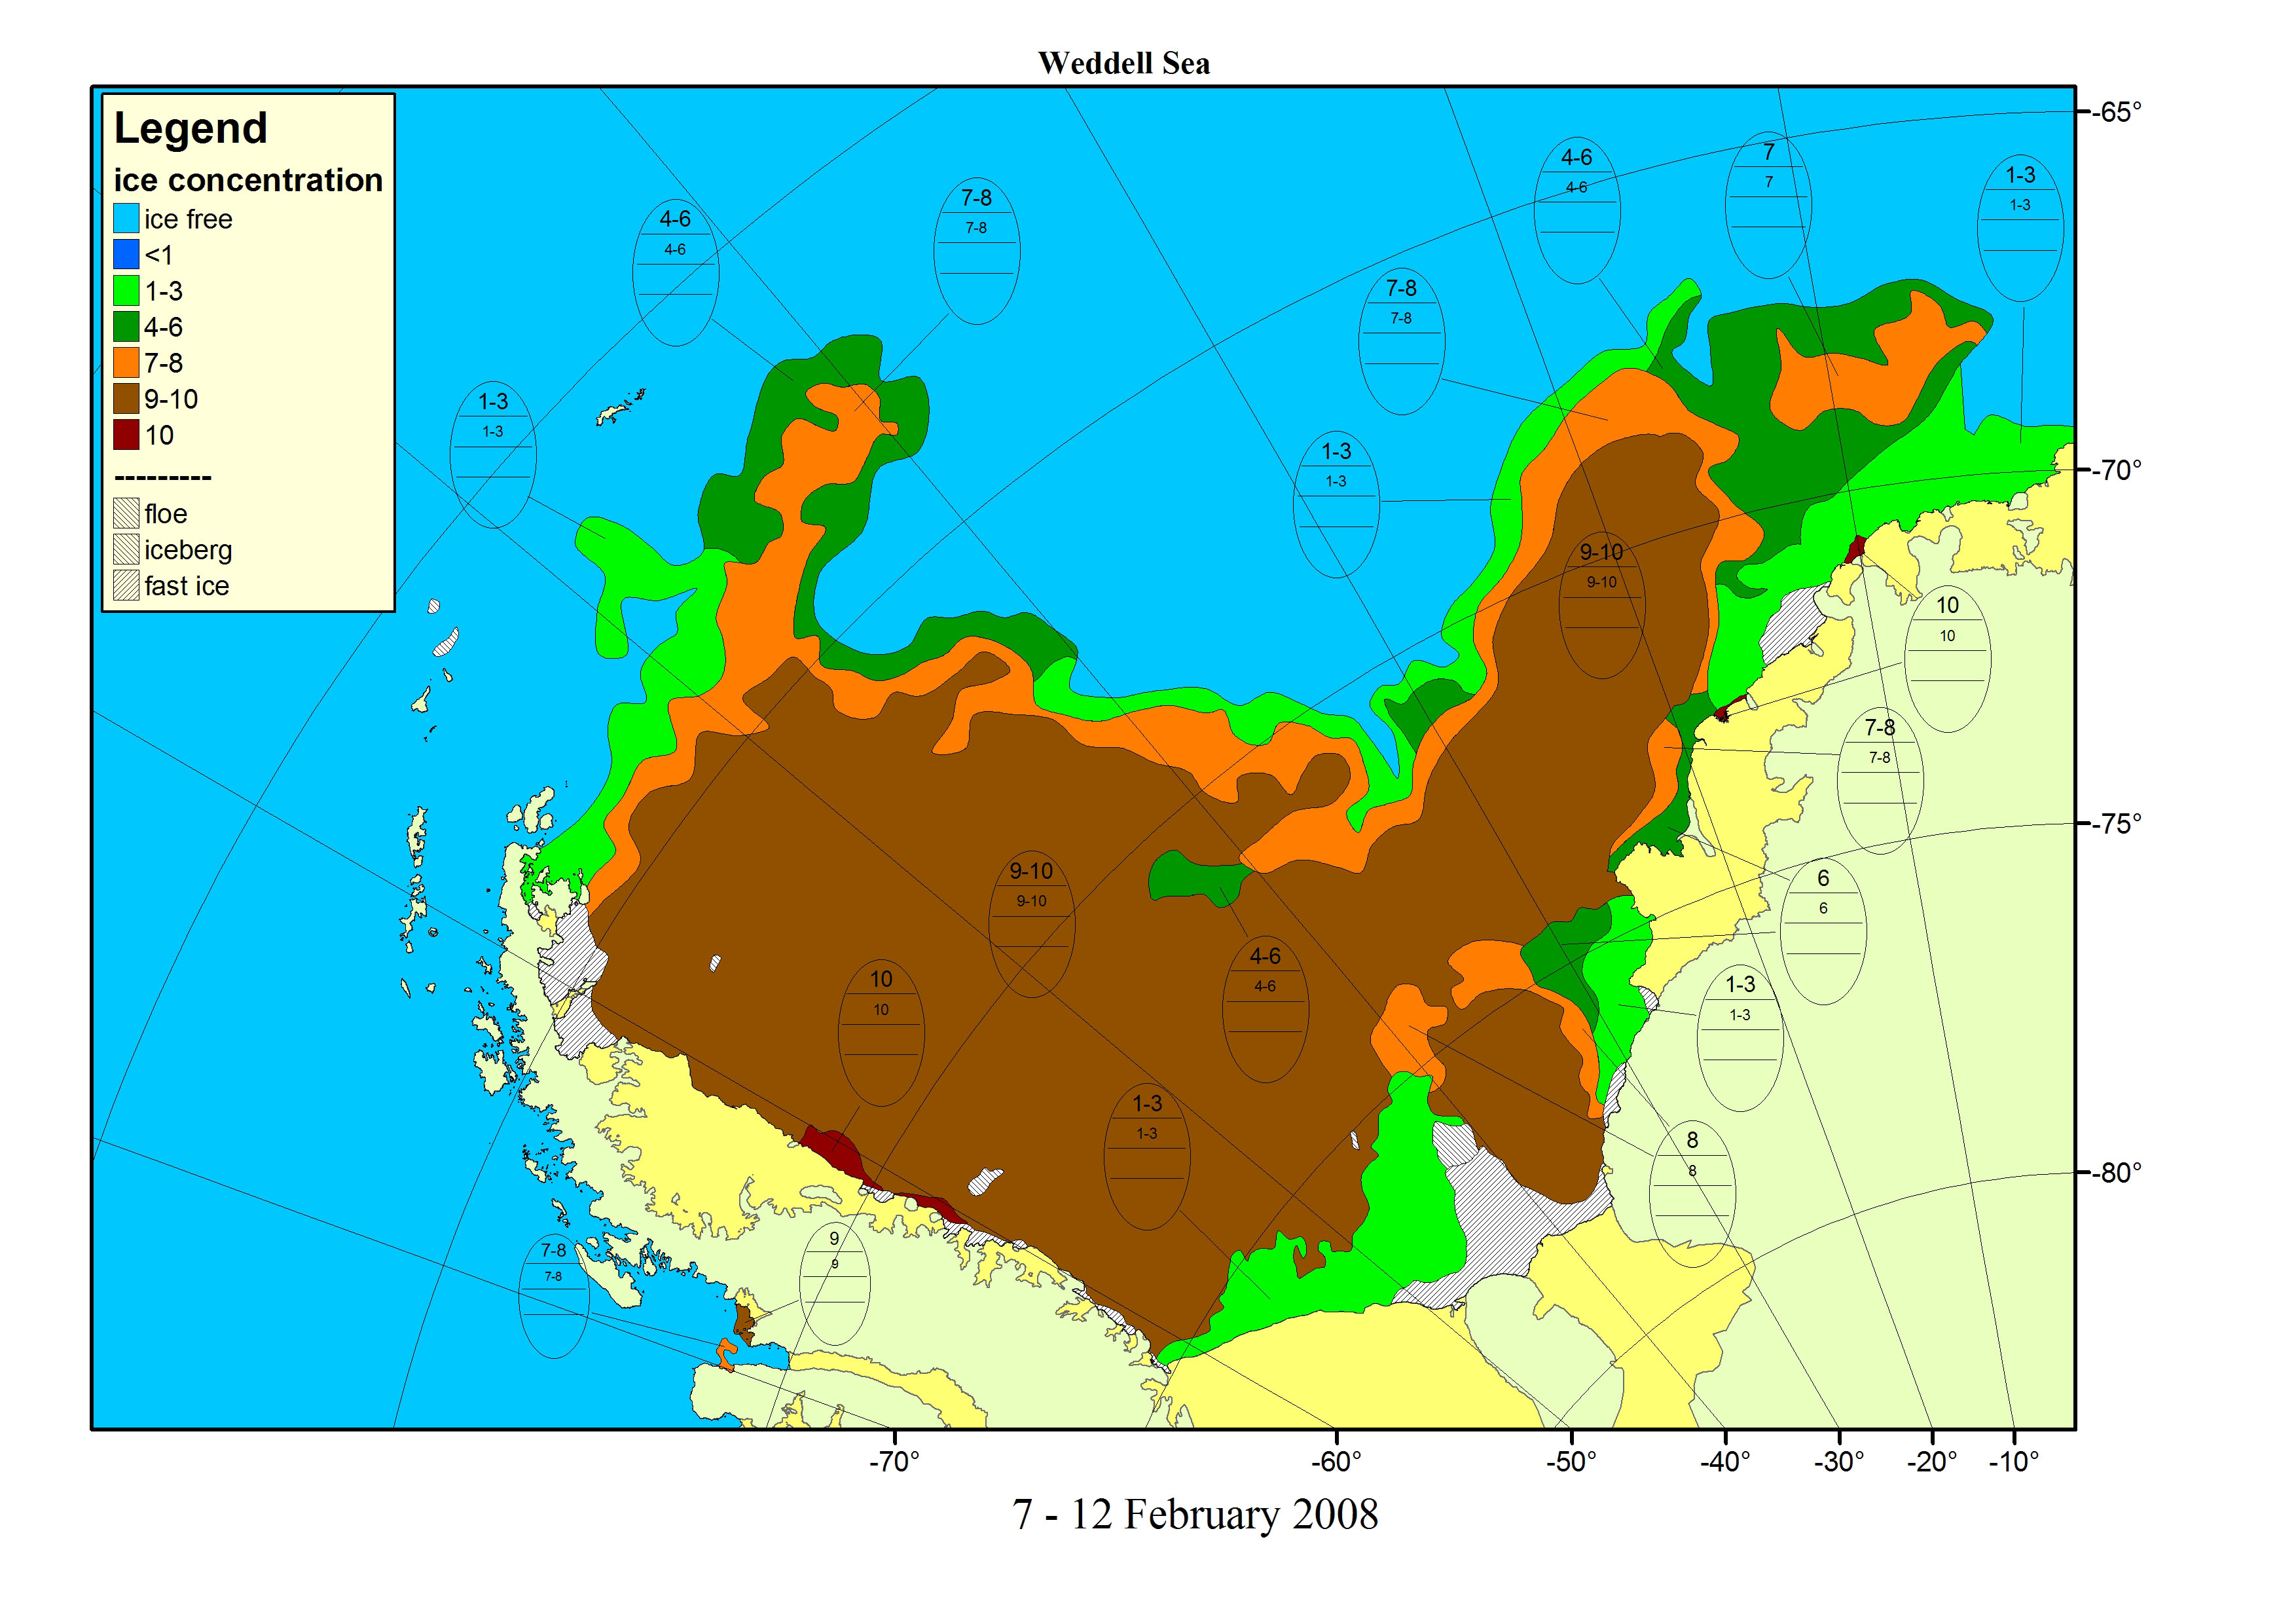
| 1, 3 | Weddell Seas |
2006-09-24..30 Chart,
data,
AMSR
2008-01-07..10 Chart, data, AMSR 2008-02-07..12 Chart, data, AMSR data=MODIS,ENVISAT,GMM-QScat VV |
Ice boundary, total concentration analysis, fast ice detection | AARI |
| 2 | Ross Sea | 2008-02-12 12:33,17:35 & 19:14 ENVISAT WSM | Fast ice, icebergs, total concentration and nilas | AARI |
| 2 | Ross Sea | 2008-02-20 20:04 & 2008-02-17 19:58 ENVISAT WSM | Ice formation, nilas, icebergs | AARI |
| 2 | Weddell Sea | 2007-10-18 05:32 & 12:09 ENVISAT WSM |
Polynyas, icebergs, fast ice boundary, old ice | AARI |
| 2 | Antarctic peninsula (Bellingshausen Sea) | 2007-09-29..10.01 &
2007-09-30
& 2007-10-01 ENVISAT GMM 3 days mosaic |
Icebergs, FY/MY ice, nilas | AARI |
| 1 | Weddell Sea | 2007-01-30 MODIS (data folder) |
Ice boundary, FY/MY ice, icebergs | AARI |
Baltic Materials
One possibiity to access the accuracy of ice charts is to determine all errors sources and calculate how these errors propagate into the final ice chart. Another possibility is to make several "measurements" and evaluate the differences. Whereas this is easy for measurments like temperature, it is not so straight forward for ice charts. The Baltic is probably the only region where several, "independent" ice charts exists over a long period in time. So it should be possible to estimate how the uncertainities in the ice charts have changed over time. For recent ice charts also all information used in the production, or that could be used, is also available, so that differences should be better explainable.
Historic Baltic Charts
Historic ice charts from different ice services for a same day are available here in two different resolutions, medium (still being up to 3MB) and large (up to 13MB).
| Date | Germany | Poland | Sweden | Finland |
| 01.02.1963 | medium / large | medium / large | medium / large | medium / large |
| 21.03.1988 | medium / large | medium / large | medium / large | medium / large |
Baltic Charts from current season 2007/08
| Description | 24.3 | 25.3 |
| Finnish ice chart | ||
| German ice chart | - | |
| Polish ice chart | - | |
| Russian ice chart | ||
| Swedish ice chart | ||
| NOAA satellit image | JPG, (jgw1) | JPG, (jgw1) |
| AMSR satellit image | JPG, (jgw1) | JPG, (jgw1) |
| MODIS Rapidfire Toravere (Gulf of Finland) | Terra, Aqua | Cloudy |
| MODIS swath | Terra, Aqua | Terra, Aqua |
| MODIS Gulf of Bothnia | Tif |
|
| Radarsat image |
Tif(23.3) Tif(24.3) |
Tif(26.3) |
| Envisat ASAR | packed | -.- |
| textual description, station ice codes | Icebreaker report | Amtsblatt |
| 1 A wordfile for a World Mercator projection. |
Sea ice regulatory publications
All of these documents are hosted at the JCOMM services pages underDocuments.
- WMO Sea Ice Nomenclature in English/French/Russian/Spanish.
- SIGRID-3: A vector archive format for sea ice charts
- Ice charts colour code
- Draft for the new ( WMO Sea Ice Nomenclature)
- ETSI-III & GDSIDB-XI final report (JCOMM Expert Team on Sea Ice (ETSI) Third Session and Steering Group for the Global Digital Sea Ice)
- Sea-Ice information Services in the World
Remark on references for charts and data. This page is intended as a fast and open source for access to the materials which will be used at the workshop. Before using these materials for other purposes, please make shure (e.G. by sending an email to ice[at]bsh.de) how to correctly cite the data. Complete references will be given after the workshop in the workshop summary.